boxplot module
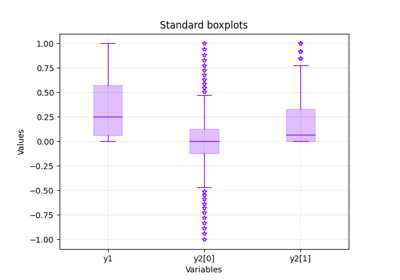
Draw the boxplots of some variables from a Dataset.
A boxplot represents the median and the first and third quartiles of numerical data. The variability outside the inter quartile domain can be represented with lines, called whiskers. The numerical data that are significantly different are called outliers and can be plotted as individual points beyond the whiskers.
- class gemseo.post.dataset.boxplot.Boxplot(dataset, *datasets, variables=None, center=False, scale=False, use_vertical_bars=True, add_confidence_interval=False, add_outliers=True, **boxplot_options)[source]
Bases:
DatasetPlotDraw the boxplots of some variables from a
Dataset.- Parameters:
dataset (Dataset) – The dataset containing the data to plot.
*datasets (Dataset) – Datasets containing other series of data to plot.
variables (Sequence[str] | None) – The names of the variables to plot. If
None, use all the variables.center (bool) –
Whether to center the variables so that they have a zero mean.
By default it is set to False.
scale (bool) –
Whether to scale the variables so that they have a unit variance.
By default it is set to False.
use_vertical_bars (bool) –
Whether to use vertical bars.
By default it is set to True.
add_confidence_interval (bool) –
Whether to add the confidence interval (CI) around the median; a CI is also called notch.
By default it is set to False.
add_outliers (bool) –
Whether to add the outliers.
By default it is set to True.
**boxplot_options (Any) – The options of the wrapped boxplot function.
- Raises:
ValueError – If the dataset is empty.
- execute(save=True, show=False, file_path=None, directory_path=None, file_name=None, file_format=None, properties=None, fig=None, axes=None, **plot_options)
Execute the post-processing.
- Parameters:
save (bool) –
If True, save the plot.
By default it is set to True.
show (bool) –
If True, display the plot.
By default it is set to False.
file_path (str | Path | None) – The path of the file to save the figures. If None, create a file path from
directory_path,file_nameandfile_format.directory_path (str | Path | None) – The path of the directory to save the figures. If None, use the current working directory.
file_name (str | None) – The name of the file to save the figures. If None, use a default one generated by the post-processing.
file_format (str | None) – A file format, e.g. ‘png’, ‘pdf’, ‘svg’, … If None, use a default file extension.
properties (Mapping[str, DatasetPlotPropertyType] | None) – The general properties of a
DatasetPlot.fig (None | Figure) – The figure to plot the data. If
None, create a new one.axes (None | Axes) – The axes to plot the data. If
None, create new ones.**plot_options – The options of the current class inheriting from
DatasetPlot.
- Returns:
The figures.
- Raises:
AttributeError – When the name of a property is not the name of an attribute.
- Return type:
list[Figure]