Monitoring the execution of a scenario
When a scenario is executed (see Tutorial: How to solve an MDO problem for building a scenario), GEMSEO logs the last computed value of the objective
function. But a finer monitoring may be needed, especially in case of crash.
In a situation like this, the current execution status of the MDODiscipline is useful as well.
In this page, the different monitoring modes of a GEMSEO scenario are illustrated on the Sobieski MDF test case.
For that, by means of the API function create_discipline(), we build the MDODiscipline:
from gemseo import create_discipline

disciplines = create_discipline(["SobieskiStructure",
                                 "SobieskiPropulsion",
                                 "SobieskiAerodynamics",
                                 "SobieskiMission"])
and by means of the API function create_discipline(), we build the MDOScenario :
from gemseo import create_scenario

scenario = create_scenario(disciplines,
                           formulation_name="MDF",
                           objective_name="y_4",
                           design_space="design_space.csv")
Basic monitoring using logs
The simplest way to monitor a change in the statuses of the disciplines is to log them in the console or in a file using GEMSEO’s logger.
Use configure_logger() to configure the logger to log in a file.
The method xdsmize() of the Scenario
can be used to this aim (monitor=True).
If the option save_html is set to True, a self-contained html file will be generated. It may be opened automatically with the option show_html=True.
If save_pdf is True, it will generate a XDSMjs input file XDSM visualization.
If will log the status of the workflow if log_workflow_status=True:
scenario.xdsmize(monitor=True, log_workflow_status=True, show_html=False)
This generates outputs such as the following, where the process’ hierarchy is represented by a flatten JSON structure.
Optimization: |          | 0/5   0% [elapsed: 00:00 left: ?, ? iters/sec]
{MDOScenario(RUNNING), {MDAChain(RUNNING), [{MDAGaussSeidel(PENDING), [SobieskiStructure(None), SobieskiPropulsion(None), SobieskiAerodynamics(None), ], }, SobieskiMission(None), ], }, }
{MDOScenario(RUNNING), {MDAChain(RUNNING), [{MDAGaussSeidel(RUNNING), [SobieskiStructure(PENDING), SobieskiPropulsion(None), SobieskiAerodynamics(None), ], }, SobieskiMission(None), ], }, }
{MDOScenario(RUNNING), {MDAChain(RUNNING), [{MDAGaussSeidel(RUNNING), [SobieskiStructure(RUNNING), SobieskiPropulsion(None), SobieskiAerodynamics(None), ], }, SobieskiMission(None), ], }, }
{MDOScenario(RUNNING), {MDAChain(RUNNING), [{MDAGaussSeidel(RUNNING), [SobieskiStructure(DONE), SobieskiPropulsion(PENDING), SobieskiAerodynamics(None), ], }, SobieskiMission(None), ], }, }
{MDOScenario(RUNNING), {MDAChain(RUNNING), [{MDAGaussSeidel(RUNNING), [SobieskiStructure(DONE), SobieskiPropulsion(RUNNING), SobieskiAerodynamics(None), ], }, SobieskiMission(None), ], }, }
{MDOScenario(RUNNING), {MDAChain(RUNNING), [{MDAGaussSeidel(RUNNING), [SobieskiStructure(DONE), SobieskiPropulsion(DONE), SobieskiAerodynamics(PENDING), ], }, SobieskiMission(None), ], }, }
{MDOScenario(RUNNING), {MDAChain(RUNNING), [{MDAGaussSeidel(RUNNING), [SobieskiStructure(DONE), SobieskiPropulsion(DONE), SobieskiAerodynamics(RUNNING), ], }, SobieskiMission(None), ], }, }
{MDOScenario(RUNNING), {MDAChain(RUNNING), [{MDAGaussSeidel(RUNNING), [SobieskiStructure(PENDING), SobieskiPropulsion(DONE), SobieskiAerodynamics(DONE), ], }, SobieskiMission(None), ], }, }
{MDOScenario(RUNNING), {MDAChain(RUNNING), [{MDAGaussSeidel(RUNNING), [SobieskiStructure(RUNNING), SobieskiPropulsion(DONE), SobieskiAerodynamics(DONE), ], }, SobieskiMission(None), ], }, }
{MDOScenario(RUNNING), {MDAChain(RUNNING), [{MDAGaussSeidel(RUNNING), [SobieskiStructure(DONE), SobieskiPropulsion(PENDING), SobieskiAerodynamics(DONE), ], }, SobieskiMission(None), ], }, }
Graphical monitoring using XDSMjs
An XDSM visualization diagram with the status of the MDODiscipline can be generated at each status change
of the MDODiscipline. See XDSM visualization for setting up the XDSM generation in a web browser.
To trigger this mode in a scenario, use xdsmize(), with the monitor argument set to True.
The path to the XDSMjs library must be set to the folder containing the XDSMjs HTML files.
scenario.xdsmize(monitor=True, directory_path="results_path")
The following images shows the typical outputs of the process statuses
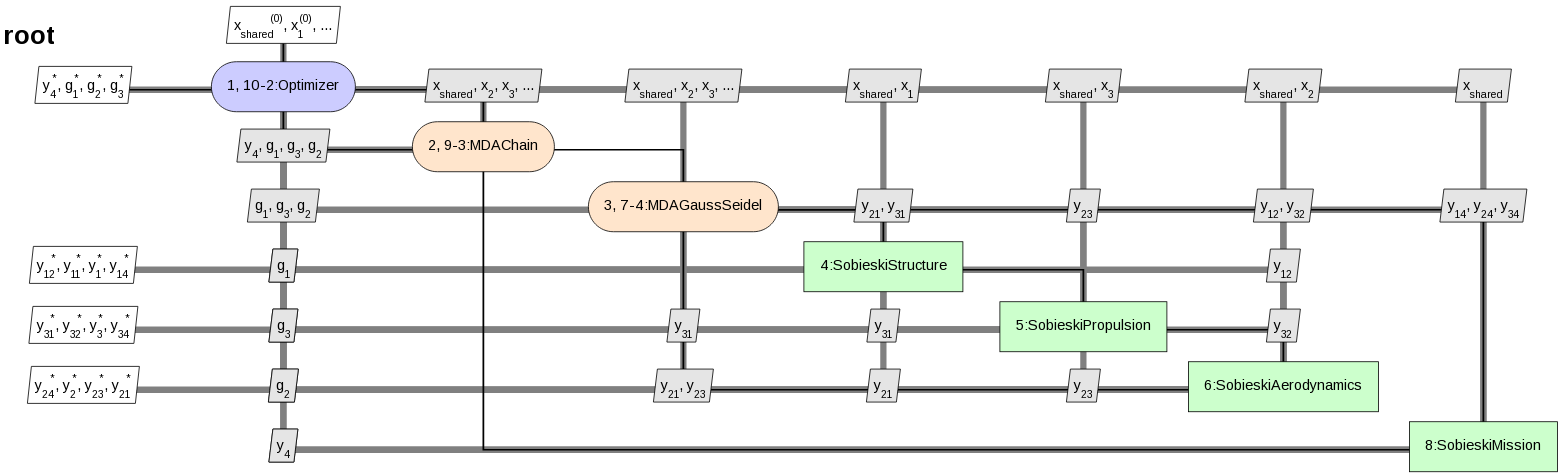
Initial state of the process before execution: the colors represent the type of discipline (scenario, MDA, simple discipline)
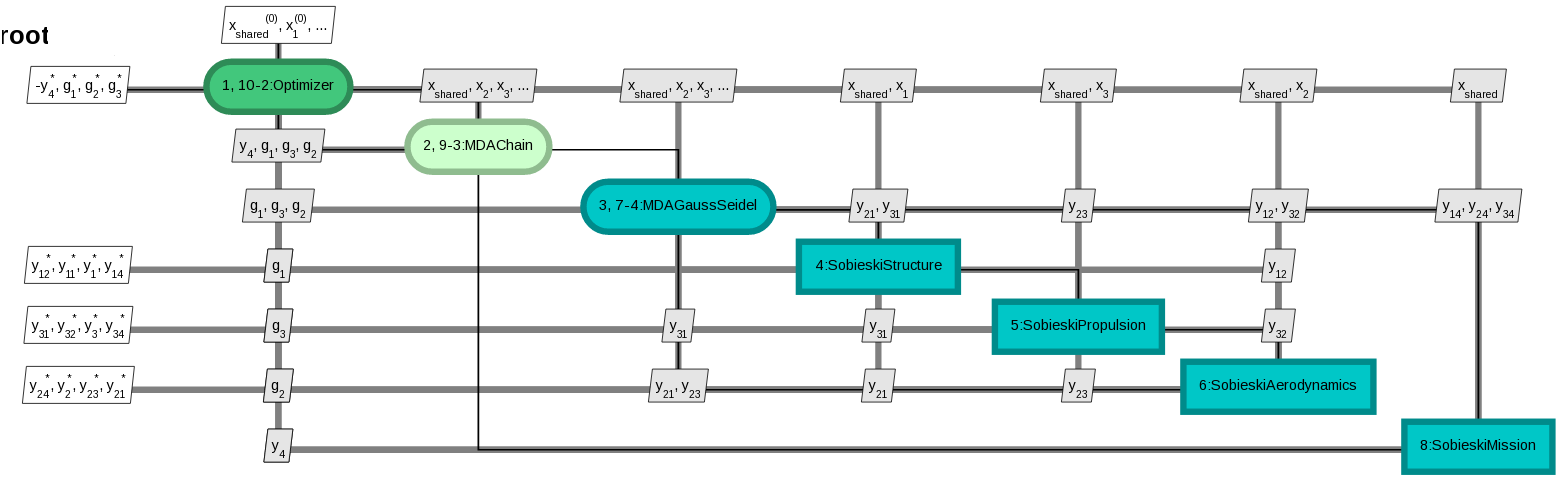
The process has started: the colors represent the status of the disciplines : green for RUNNING, blue for PENDING, red for FAILED
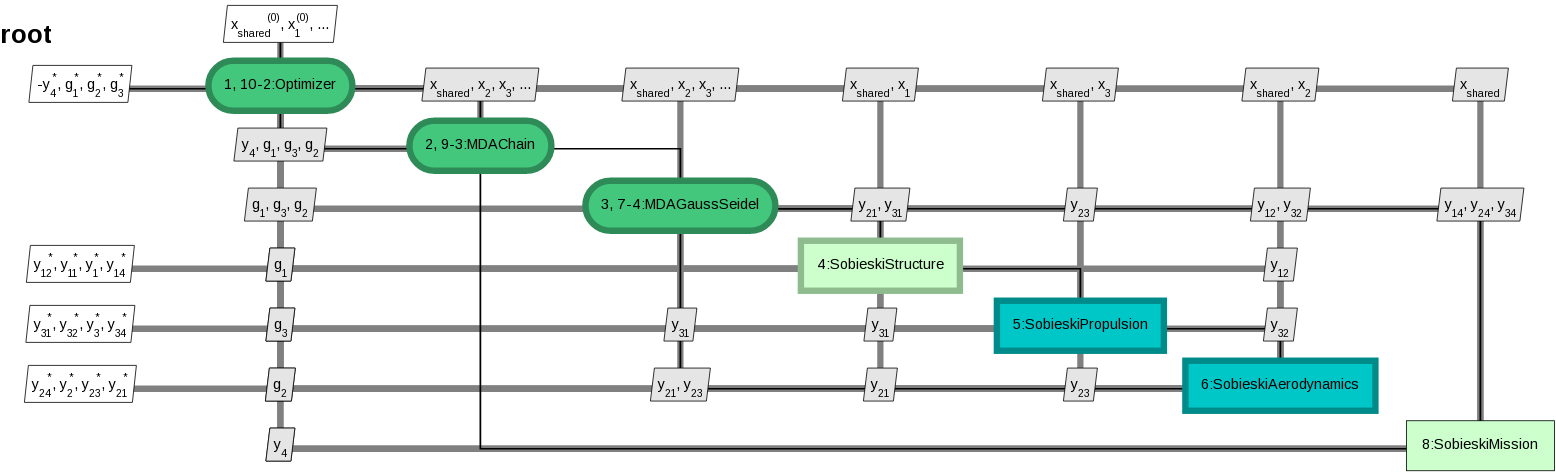
The process is running, the MDA iterations are ongoing
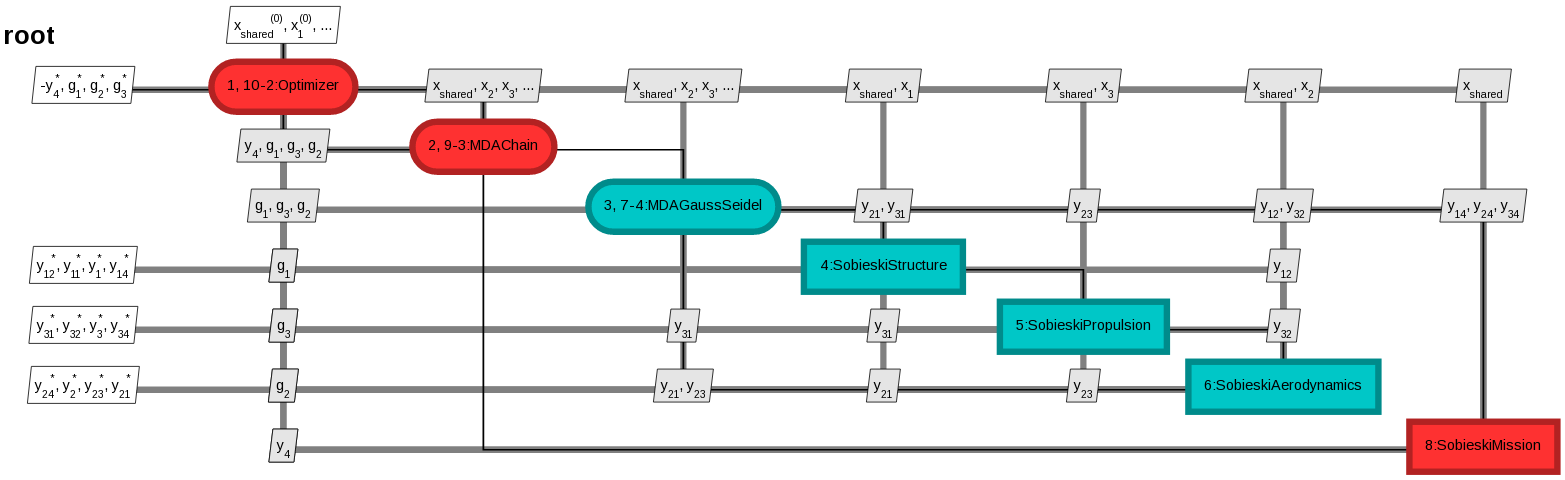
The process is finished and failed, due to the SobieskiMission discipline failure
Monitoring from a external platform using the observer design pattern
The monitoring interface can be used to generate events every time that the process status changes. One can observe these events and program a platform to react and display information to the user, or store data in a database. The observer design pattern is used.
In the following code, we create an Observer object that implements an update method.
Then, by means of the API function monitor_scenario(), we create a Monitoring
and add the observer to the list of the listeners that are notified by GEMSEO monitoring system.
from gemseo import monitor_scenario

class Observer(object):

    def update(self, atom):
        print(atom)

observer = Observer()
monitor_scenario(scenario, observer)
The scenario execution generates the following output log:
MDAChain(RUNNING)
MDAGaussSeidel(RUNNING)
SobieskiStructure(RUNNING)
SobieskiStructure(DONE)
SobieskiPropulsion(RUNNING)
SobieskiPropulsion(DONE)
SobieskiAerodynamics(RUNNING)
SobieskiAerodynamics(DONE)
SobieskiStructure(RUNNING)
SobieskiStructure(DONE)
SobieskiPropulsion(RUNNING)
SobieskiPropulsion(DONE)
# ...
More advanced use can be made of this notification system, since the atom has the discipline concerned by the status change as an attribute. Therefore, one can programmatically track the execution; or the data creation by the discipline’s execution, and store it.
Monitoring using a Gantt chart
A Gantt chart can be generated to visualize the process execution. All discipline’s execution and linearization times are recorded and plotted.
To activate the execution times recording, which are required to plot the Gantt chart, please enable the time stamps before executing the scenario.
from gemseo.core.discipline import MDODiscipline
MDODiscipline.activate_time_stamps()
Then, after the scenario execution, the Gantt chart can be created easily.
from gemseo.post.core.gantt_chart import create_gantt_chart

create_gantt_chart(save=True, show=False)
This generates the following plot, here on a Sobieski MDF scenario.
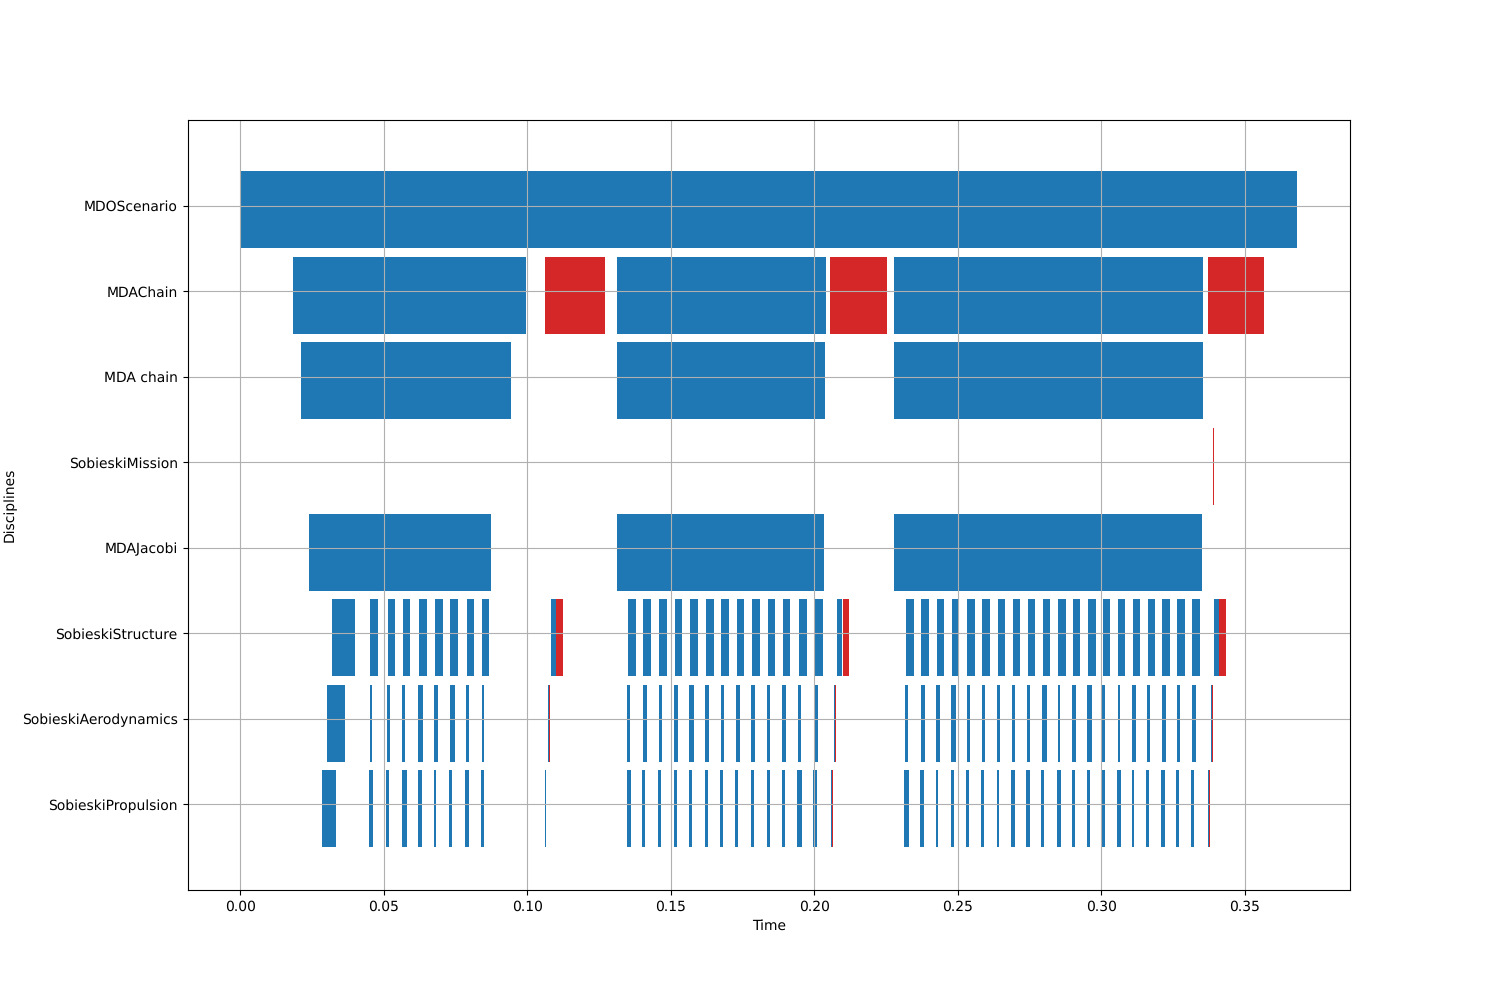
The Gantt chart: disciplines are sorted by names, each discipline has a dedicated row. The blue rectangles correspond to the execution time while the red ones represent linearization time.