Note
Go to the end to download the full example code.
Scalers#
from __future__ import annotations

import matplotlib.pyplot as plt
from numpy import linspace

from gemseo.mlearning.transformers.scaler.min_max_scaler import MinMaxScaler
from gemseo.mlearning.transformers.scaler.scaler import Scaler
from gemseo.mlearning.transformers.scaler.standard_scaler import StandardScaler
Scaling data may be important, as discussed in another example. Different scalers are available and this example illustrate them with these simple data:
data = linspace(-2, 2, 100)
First,
a Scaler transforms a value \(x\) into a new value \(\tilde{x}\)
based on the linear function \(\tilde{x}=a+bx\).
By default, the offset \(a\) is zero and the coefficient \(b\) is one:
default_scaler = Scaler()
We can set these coefficient and offset at instantiation:
custom_scaler = Scaler(offset=-1, coefficient=0.5)
or use a specific Scaler for that,
e.g. a MinMaxScaler:
min_max_scaler = MinMaxScaler()
or a StandardScaler:
standard_scaler = StandardScaler()
In this case,
the coefficient and offset will be computed from data.
Now,
we fit each scaler from data and transform these data:
same_data = default_scaler.fit_transform(data)
scaled_data = custom_scaler.fit_transform(data)
min_max_scaled_data = min_max_scaler.fit_transform(data)
standard_scaled_data = standard_scaler.fit_transform(data)
We can plot the transformed data versus the original one:
plt.plot(data, default_scaler.fit_transform(data), label="Default scaler")
plt.plot(data, custom_scaler.fit_transform(data), label="Custom scaler")
plt.plot(data, min_max_scaler.fit_transform(data), label="Min-max scaler")
plt.plot(data, standard_scaler.fit_transform(data), label="Standard scaler")
plt.legend()
plt.grid()
plt.show()
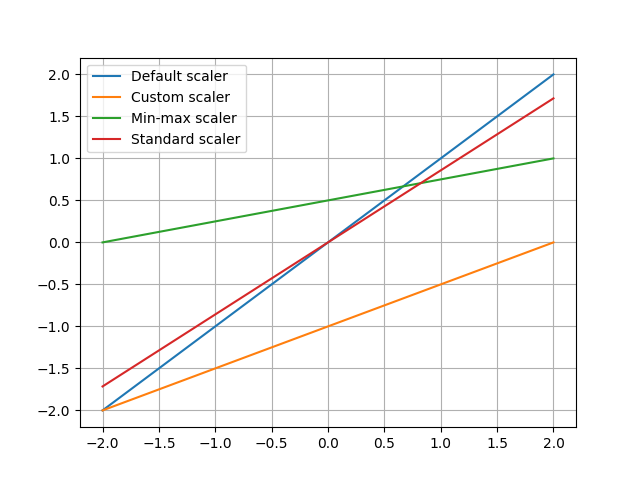
The specific features of the different scalers are clearly visible.
In particular,
the MinMaxScaler projects the data onto the interval \([0,1]\)
as long as this data is included in the fitting interval.
The StandardScaler guarantees that
the transformed data have zero mean and unit variance.
Lastly, every scaler can compute the Jacobian, e.g.
custom_scaler.compute_jacobian(data)
array([[0.5]])
Total running time of the script: (0 minutes 0.056 seconds)