Note
Click here to download the full example code
Plot - Scatter matrix
from gemseo.api import configure_logger
from gemseo.api import load_dataset
from gemseo.post.dataset.scatter_plot_matrix import ScatterMatrix
from matplotlib import pyplot as plt

configure_logger()
Out:
<RootLogger root (INFO)>
Load a dataset
iris = load_dataset("IrisDataset")
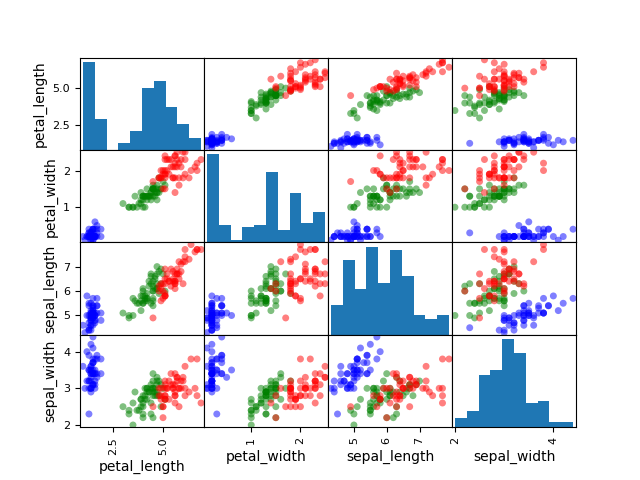
Plot scatter matrix
We can use the ScatterMatrix plot where each non-diagonal block
represents the samples according to the x- and y- coordinates names
while the diagonal ones approximate the probability distributions of the
variables, using either an histogram or a kernel-density estimator.
ScatterMatrix(iris, classifier="specy").execute(save=False, show=False)
# Workaround for HTML rendering, instead of ``show=True``
plt.show()
Out:
/home/docs/checkouts/readthedocs.org/user_builds/gemseo/envs/4.0.0/lib/python3.9/site-packages/gemseo/post/dataset/scatter_plot_matrix.py:135: UserWarning: To output multiple subplots, the figure containing the passed axes is being cleared.
  sub_axes = scatter_matrix(
Total running time of the script: ( 0 minutes 0.643 seconds)