scatter_plot_matrix module
Draw a scatter matrix from a Dataset.
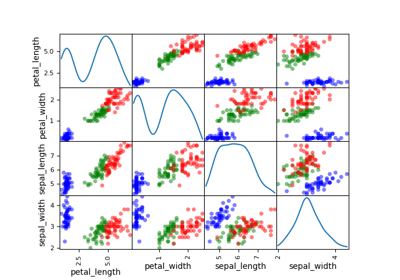
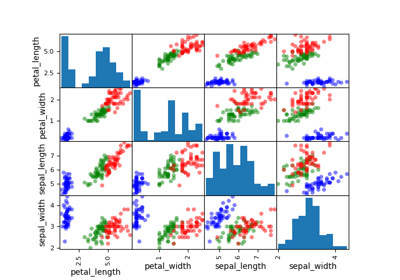
The ScatterMatrix class implements the scatter plot matrix,
which is a way to visualize \(n\) samples of a
multi-dimensional vector
in several 2D subplots where the (i,j) subplot represents the cloud of points
while the (i,i) subplot represents the empirical distribution of the samples
by means of an histogram or a kernel density estimator.
A variable name can be passed to the DatasetPlot.execute() method
by means of the classifier keyword in order to color the curves
according to the value of the variable name. This is useful when the data is
labeled.
- class gemseo.post.dataset.scatter_plot_matrix.ScatterMatrix(dataset, variable_names=None, classifier=None, kde=False, size=25, marker='o', plot_lower=True, plot_upper=True)[source]
Bases:
DatasetPlotScatter plot matrix.
- Parameters:
dataset (Dataset) – The dataset containing the data to plot.
variable_names (Sequence[str] | None) – The description is missing.
classifier (str | None) – The name of the variable to build the cluster.
kde (bool) –
The type of the distribution representation. If True, plot kernel-density estimator on the diagonal. Otherwise, use histograms.
By default it is set to False.
size (int) –
The size of the points.
By default it is set to 25.
marker (str) –
The marker for the points.
By default it is set to “o”.
plot_lower (bool) –
Whether to plot the lower part.
By default it is set to True.
plot_upper (bool) –
Whether to plot the upper part.
By default it is set to True.
- Raises:
ValueError – If the dataset is empty.
- execute(save=True, show=False, file_path=None, directory_path=None, file_name=None, file_format=None, properties=None, fig=None, axes=None, **plot_options)
Execute the post processing.
- Parameters:
save (bool) –
If True, save the plot.
By default it is set to True.
show (bool) –
If True, display the plot.
By default it is set to False.
file_path (str | Path | None) – The path of the file to save the figures. If None, create a file path from
directory_path,file_nameandfile_format.directory_path (str | Path | None) – The path of the directory to save the figures. If None, use the current working directory.
file_name (str | None) – The name of the file to save the figures. If None, use a default one generated by the post-processing.
file_format (str | None) – A file format, e.g. ‘png’, ‘pdf’, ‘svg’, … If None, use a default file extension.
properties (Mapping[str, DatasetPlotPropertyType] | None) – The general properties of a
DatasetPlot.fig (None | Figure) – The figure to plot the data. If
None, create a new one.axes (None | Axes) – The axes to plot the data. If
None, create new ones.**plot_options – The options of the current class inheriting from
DatasetPlot.
- Returns:
The figures.
- Raises:
AttributeError – When the name of a property is not the name of an attribute.
- Return type:
list[Figure]