scatter_plot_matrix module
Draw a scatter matrix from a Dataset.
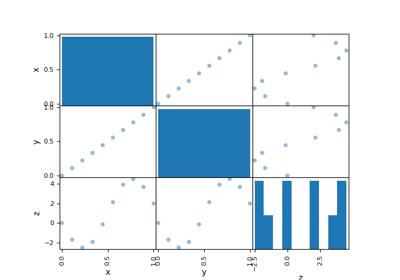
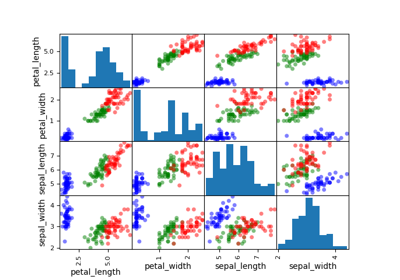
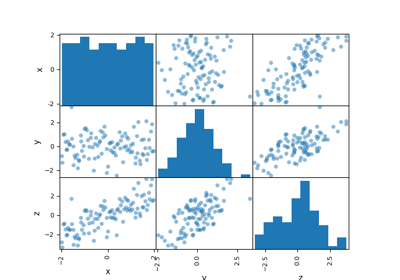
The ScatterMatrix class implements the scatter plot matrix,
which is a way to visualize \(n\) samples of a
multi-dimensional vector
in several 2D subplots where the (i,j) subplot represents the cloud of points
while the (i,i) subplot represents the empirical distribution of the samples
by means of an histogram or a kernel density estimator.
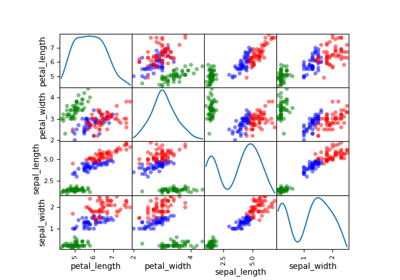
A variable name can be passed to the DatasetPlot.execute() method
by means of the classifier keyword in order to color the curves
according to the value of the variable name. This is useful when the data is
labeled.
- class gemseo.post.dataset.scatter_plot_matrix.ScatterMatrix(dataset, variable_names=None, classifier=None, kde=False, size=25, marker='o', plot_lower=True, plot_upper=True, trend=Trend.NONE, **options)[source]
Bases:
DatasetPlotScatter plot matrix.
- Parameters:
dataset (Dataset) – The dataset containing the data to plot.
variable_names (Iterable[str] | None) – The names of the variables to consider. If
None, consider all the variables of the dataset.classifier (str | None) – The name of the variable to build the cluster.
kde (bool) –
The type of the distribution representation. If
True, plot kernel-density estimator on the diagonal. Otherwise, use histograms.By default it is set to False.
size (int) –
The size of the points.
By default it is set to 25.
marker (str) –
The marker for the points.
By default it is set to “o”.
plot_lower (bool) –
Whether to plot the lower part.
By default it is set to True.
plot_upper (bool) –
Whether to plot the upper part.
By default it is set to True.
trend (Trend | TrendFunctionCreator) –
The trend function to be added on the scatter plots or a function creating a trend function from a set of xy-points.
By default it is set to “none”.
**options (Any) – The options of the underlying pandas scatter matrix.
- Raises:
ValueError – If the dataset is empty.
- class PlotEngine(value)
Bases:
StrEnumAn engine of plots.
- MATPLOTLIB = 'MatplotlibPlotFactory'
- PLOTLY = 'PlotlyPlotFactory'
- class Trend(value)
Bases:
StrEnumA type of trend.
- CUBIC = 'cubic'
- LINEAR = 'linear'
- NONE = 'none'
- QUADRATIC = 'quadratic'
- RBF = 'rbf'
- execute(save=True, show=False, file_path='', directory_path='', file_name='', file_format='png', file_name_suffix='', **engine_parameters)
Execute the post-processing.
- Parameters:
save (bool) –
Whether to save the plot.
By default it is set to True.
show (bool) –
Whether to display the plot.
By default it is set to False.
file_path (str | Path) –
The path of the file to save the figures. If empty, create a file path from
directory_path,file_nameandfile_format.By default it is set to “”.
directory_path (str | Path) –
The path of the directory to save the figures. If empty, use the current working directory.
By default it is set to “”.
file_name (str) –
The name of the file to save the figures. If empty, use a default one generated by the post-processing.
By default it is set to “”.
file_format (str) –
A file format, e.g. ‘png’, ‘pdf’, ‘svg’, …
By default it is set to “png”.
file_name_suffix (str) –
The suffix to be added to the file name.
By default it is set to “”.
**engine_parameters (Any) – The parameters specific to the plot engine.
- Returns:
The figures.
- Return type:
- DEFAULT_PLOT_ENGINE: ClassVar[PlotEngine] = 'MatplotlibPlotFactory'
The default engine of plots.
- FILE_FORMATS_TO_PLOT_ENGINES: ClassVar[dict[str, PlotEngine]] = {'html': PlotEngine.PLOTLY}
The file formats bound to the engines of plots.
The method
execute()uses this dictionary to select the engine of plots associated with itsfile_formatargument. If missing, the method uses theDEFAULT_PLOT_ENGINE.
- property color: str | list[str]
The color.
Either a global one or one per item if
n_itemsis non-zero. If empty, use a default one.
- property fig_size: FigSizeType
The figure size.
- property linestyle: str | Sequence[str]
The line style.
Either a global one or one per item if
n_itemsis non-zero. If empty, use a default one.