scatter module
Draw a scatter plot from a Dataset.
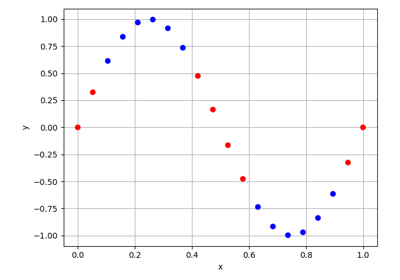
A Scatter plot represents a set of points
\(\{x_i,y_i\}_{1\leq i \leq n}\) as markers on a classical plot
where the color of points can be heterogeneous.
- class gemseo.post.dataset.scatter.Scatter(dataset, x, y, trend=Trend.NONE)[source]
Bases:
DatasetPlotPlot curve y versus x.
- Parameters:
dataset (Dataset) – The dataset containing the data to plot.
x (VariableType) – The name of the variable on the x-axis, with its optional component if not
0, e.g.("foo", 3)for the fourth component of the variable"foo".y (VariableType) – The name of the variable on the y-axis, with its optional component if not
0, e.g.("bar", 3)for the fourth component of the variable"bar".trend (Trend | TrendFunctionCreator) –
The trend function to be added on the scatter plots or a function creating a trend function from a set of xy-points.
By default it is set to “none”.
- Raises:
ValueError – If the dataset is empty.
- class Trend(value)
Bases:
StrEnumA type of trend.
- CUBIC = 'cubic'
- LINEAR = 'linear'
- NONE = 'none'
- QUADRATIC = 'quadratic'
- RBF = 'rbf'