Note
Go to the end to download the full example code.
Scatter#
from __future__ import annotations

from numpy import linspace
from numpy import pi
from numpy import sin

from gemseo.datasets.dataset import Dataset
from gemseo.post.dataset.scatter import Scatter
Build a dataset#
inputs = linspace(0, 1, 20)[:, None]
outputs = sin(2 * pi * inputs)
color = ["b" if abs(output) > 0.5 else "r" for output in outputs]

dataset = Dataset()
dataset.add_variable("x", inputs, "inputs")
dataset.add_variable("y", outputs, "outputs")
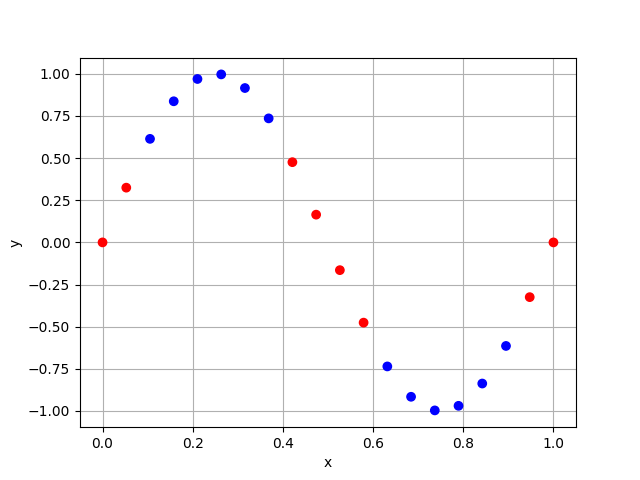
Plot y vs x#
We can use the Scatter plot
plot = Scatter(dataset, "x", "y")
plot.color = color
plot.execute(save=False, show=True)
[<Figure size 640x480 with 1 Axes>]
Total running time of the script: (0 minutes 0.065 seconds)