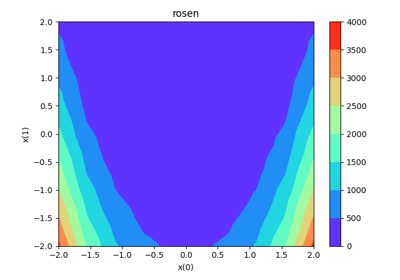
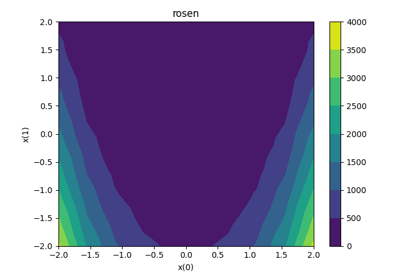
zvsxy module
Draw a variable versus two others from a Dataset.
A ZvsXY plot represents the variable \(z\) with respect to
\(x\) and \(y\) as a surface plot, based on a set of points
:points \(\{x_i,y_i,z_i\}_{1\leq i \leq n}\). This interpolation
relies on the Delaunay triangulation of \(\{x_i,y_i\}_{1\leq i \leq n}\)
- class gemseo.post.dataset.zvsxy.ZvsXY(dataset, x, y, z, add_points=False, fill=True, levels=None, other_datasets=None)[source]
Bases:
DatasetPlotPlot surface z versus x,y.
- Parameters:
dataset (Dataset) – The dataset containing the data to plot.
x (VariableType) – The name of the variable on the x-axis, with its optional component if not
0, e.g.("foo", 3)for the fourth component of the variable"foo".y (VariableType) – The name of the variable on the y-axis, with its optional component if not
0, e.g.("bar", 3)for the fourth component of the variable"bar".z (VariableType) – The name of the variable on the z-axis, with its optional component if not
0, e.g.("baz", 3)for the fourth component of the variable"baz".add_points (bool) –
Whether to display the entries of the dataset as points above the surface.
By default it is set to False.
fill (bool) –
Whether to generate a filled contour plot.
By default it is set to True.
levels (int | Sequence[int] | None) – Either the number of contour lines or the values of the contour lines in increasing order. If
None, select them automatically.other_datasets (Iterable[Dataset] | None) – Additional datasets to be plotted as points above the surface.
- Raises:
ValueError – If the dataset is empty.