Note
Go to the end to download the full example code.
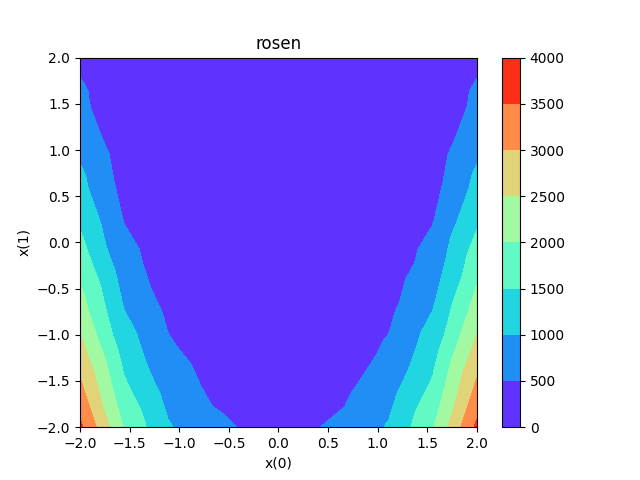
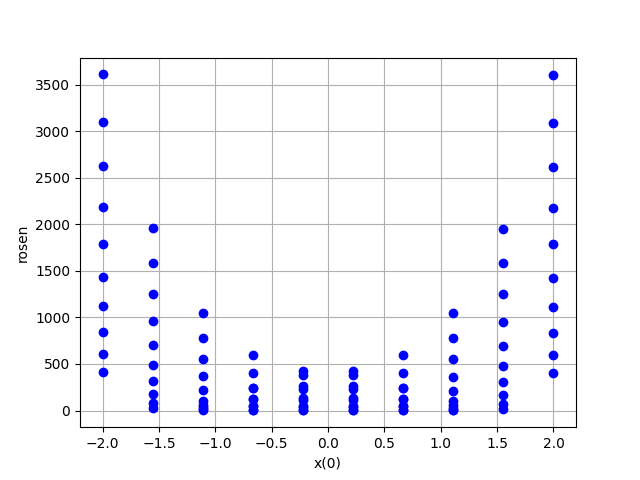
Rosenbrock dataset#
This Dataset contains 100 evaluations
of the well-known Rosenbrock function:
\[f(x,y)=(1-x)^2+100(y-x^2)^2\]
This function is known for its global minimum at point (1,1), its banana valley and the difficulty to reach its minimum.
This Dataset is based on a full-factorial
design of experiments.
More information about the Rosenbrock function
from __future__ import annotations

from gemseo import create_benchmark_dataset
from gemseo.post.dataset.yvsx import YvsX
from gemseo.post.dataset.zvsxy import ZvsXY
Load Rosenbrock dataset#
We can easily load this dataset
by means of the high-level function create_benchmark_dataset():
dataset = create_benchmark_dataset("RosenbrockDataset")
dataset
Show the design data#
dataset.design_dataset
Show the objective data#
dataset.objective_dataset
Load the data with an input-output naming#
dataset = create_benchmark_dataset("RosenbrockDataset", opt_naming=False)
dataset
Plot the data#
ZvsXY(dataset, x=("x", 0), y=("x", 1), z="rosen").execute(save=False, show=True)

YvsX(dataset, x=("x", 0), y="rosen").execute(save=False, show=True)
[<Figure size 640x480 with 1 Axes>]
Total running time of the script: (0 minutes 0.181 seconds)