Dataset#
Basics#
A generic data structure with entries and variables.
The concept of dataset is a key element for machine learning, post-processing, data analysis, ...
A Dataset is a pandas
MultiIndex DataFrame
storing series of data
representing the values of multidimensional features
belonging to different groups of features.
A Dataset can be set
either from a file (from_csv() and from_txt())
or from a NumPy array (from_array()),
and can be enriched from a group of variables (add_group())
or from a single variable (add_variable()).
An BaseFullCache or an OptimizationProblem
can also be exported to a Dataset
using the methods BaseFullCache.to_dataset()
and OptimizationProblem.to_dataset().
Visualization#
Datasets post-processing.
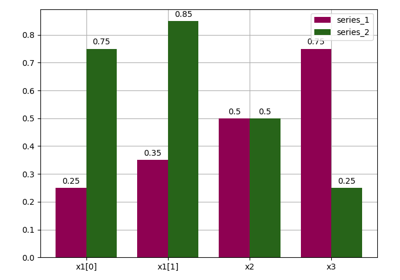
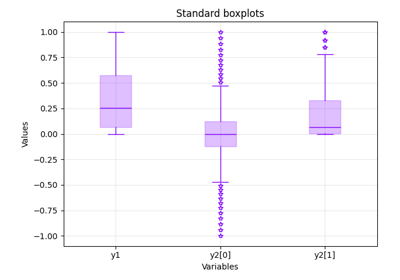
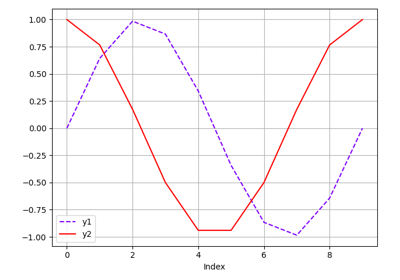
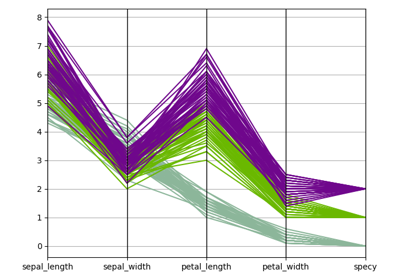
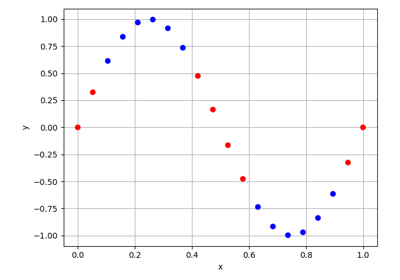
A DatasetPlot is a generic graphical representation of a Dataset
that can be displayed on screen or saved to a file.
The different visualization tools
(BasePost, BaseSensitivityAnalysis.plot(), ...)
proposed by GEMSEO rely more and more on it
to factorize the code,
separate data and graph generation
and standardize the visualizations.
As an example,
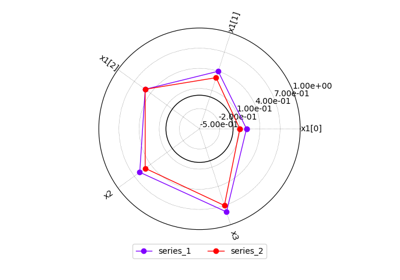
RadarChart implements a
radar chart
and is used by both
RadarChart
to visualize the constraints stored in a Database
and BaseSensitivityAnalysis.plot_radar()
to visualize the sensitivity indices generated by a BaseSensitivityAnalysis.
Problems#
Examples of datasets.
GEMSEO proposes several datasets containing academic data to illustrate its capabilities:
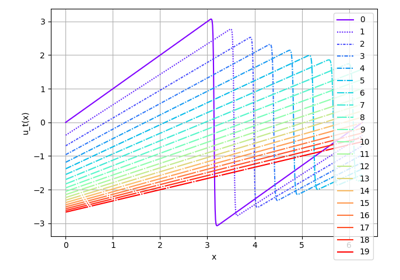
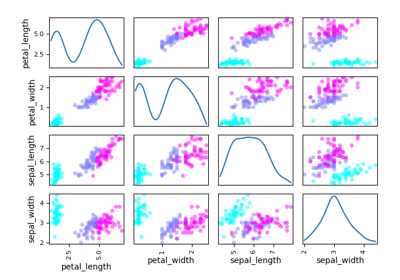
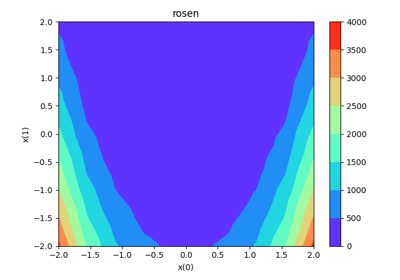
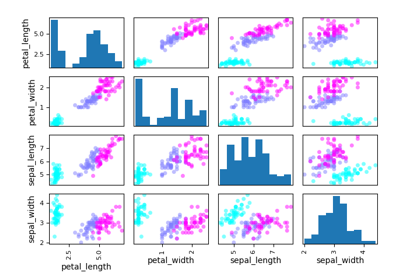
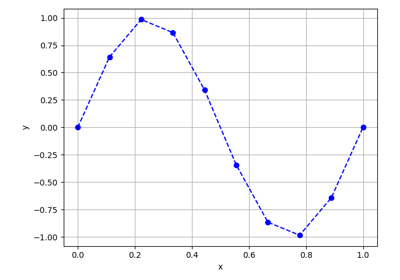
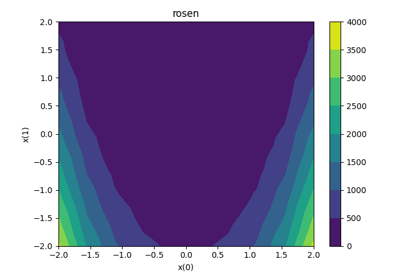
create_iris_dataset()returns a collection of iris plants, mainly used to benchmark clustering and classification algorithms,create_rosenbrock_dataset()returns a set of evaluations of the Rosenbrock function over a regular grid, initially introduced to illustrate visualization tools dedicated to surfaces such asZvsXY,create_burgers_dataset()returns a set of solutions of the Burgers' equation at given times, initially introduced to illustrate dimension reduction methods, e.g.PCAorKLSVD.
- class DatasetType(*values)[source]
The available datasets.