Note
Go to the end to download the full example code.
Correlation analysis#
from __future__ import annotations

import pprint

from gemseo.problems.uncertainty.ishigami.ishigami_discipline import IshigamiDiscipline
from gemseo.problems.uncertainty.ishigami.ishigami_space import IshigamiSpace
from gemseo.uncertainty.sensitivity.correlation_analysis import CorrelationAnalysis
In this example, we consider the Ishigami function [IH90]
implemented as an Discipline by the IshigamiDiscipline.
It is commonly used
with the independent random variables \(X_1\), \(X_2\) and \(X_3\)
uniformly distributed between \(-\pi\) and \(\pi\)
and defined in the IshigamiSpace.
discipline = IshigamiDiscipline()
uncertain_space = IshigamiSpace()
Then,
we run sensitivity analysis of type CorrelationAnalysis:
sensitivity_analysis = CorrelationAnalysis()
sensitivity_analysis.compute_samples([discipline], uncertain_space, 1000)
sensitivity_analysis.compute_indices()
INFO - 16:14:08: *** Start CorrelationAnalysisSamplingPhase execution ***
INFO - 16:14:08: CorrelationAnalysisSamplingPhase
INFO - 16:14:08: Disciplines: IshigamiDiscipline
INFO - 16:14:08: MDO formulation: MDF
INFO - 16:14:08: Running the algorithm OT_MONTE_CARLO:
INFO - 16:14:08: 1%| | 6/1000 [00:00<00:00, 1825.86 it/sec]
INFO - 16:14:08: 1%| | 7/1000 [00:00<00:00, 1916.08 it/sec]
INFO - 16:14:08: 1%| | 8/1000 [00:00<00:00, 2049.50 it/sec]
INFO - 16:14:08: 1%| | 9/1000 [00:00<00:00, 2175.09 it/sec]
INFO - 16:14:08: 1%| | 10/1000 [00:00<00:00, 2270.38 it/sec]
INFO - 16:14:08: 1%| | 11/1000 [00:00<00:00, 2372.10 it/sec]
INFO - 16:14:08: 1%| | 12/1000 [00:00<00:00, 2466.03 it/sec]
INFO - 16:14:08: 1%|▏ | 13/1000 [00:00<00:00, 2551.04 it/sec]
INFO - 16:14:08: 1%|▏ | 14/1000 [00:00<00:00, 2615.14 it/sec]
INFO - 16:14:08: 2%|▏ | 15/1000 [00:00<00:00, 2631.86 it/sec]
INFO - 16:14:08: 2%|▏ | 16/1000 [00:00<00:00, 2693.51 it/sec]
INFO - 16:14:08: 2%|▏ | 17/1000 [00:00<00:00, 2745.39 it/sec]
INFO - 16:14:08: 2%|▏ | 18/1000 [00:00<00:00, 2797.14 it/sec]
INFO - 16:14:08: 2%|▏ | 19/1000 [00:00<00:00, 2846.34 it/sec]
INFO - 16:14:08: 2%|▏ | 20/1000 [00:00<00:00, 2894.02 it/sec]
INFO - 16:14:08: 2%|▏ | 21/1000 [00:00<00:00, 2940.23 it/sec]
INFO - 16:14:08: 2%|▏ | 22/1000 [00:00<00:00, 2973.63 it/sec]
INFO - 16:14:08: 2%|▏ | 23/1000 [00:00<00:00, 3015.69 it/sec]
INFO - 16:14:08: 2%|▏ | 24/1000 [00:00<00:00, 3056.52 it/sec]
INFO - 16:14:08: 2%|▎ | 25/1000 [00:00<00:00, 3095.52 it/sec]
INFO - 16:14:08: 3%|▎ | 26/1000 [00:00<00:00, 3124.43 it/sec]
INFO - 16:14:08: 3%|▎ | 27/1000 [00:00<00:00, 3156.34 it/sec]
INFO - 16:14:08: 3%|▎ | 28/1000 [00:00<00:00, 3189.58 it/sec]
INFO - 16:14:08: 3%|▎ | 29/1000 [00:00<00:00, 3222.03 it/sec]
INFO - 16:14:08: 3%|▎ | 30/1000 [00:00<00:00, 3242.85 it/sec]
INFO - 16:14:08: 3%|▎ | 31/1000 [00:00<00:00, 3269.38 it/sec]
INFO - 16:14:08: 3%|▎ | 32/1000 [00:00<00:00, 3294.41 it/sec]
INFO - 16:14:08: 3%|▎ | 33/1000 [00:00<00:00, 3320.35 it/sec]
INFO - 16:14:08: 3%|▎ | 34/1000 [00:00<00:00, 3344.82 it/sec]
INFO - 16:14:08: 4%|▎ | 35/1000 [00:00<00:00, 3358.44 it/sec]
INFO - 16:14:08: 4%|▎ | 36/1000 [00:00<00:00, 3379.32 it/sec]
INFO - 16:14:08: 4%|▎ | 37/1000 [00:00<00:00, 3400.74 it/sec]
INFO - 16:14:08: 4%|▍ | 38/1000 [00:00<00:00, 3422.01 it/sec]
INFO - 16:14:08: 4%|▍ | 39/1000 [00:00<00:00, 3435.64 it/sec]
INFO - 16:14:08: 4%|▍ | 40/1000 [00:00<00:00, 3454.23 it/sec]
INFO - 16:14:08: 4%|▍ | 41/1000 [00:00<00:00, 3474.98 it/sec]
INFO - 16:14:08: 4%|▍ | 42/1000 [00:00<00:00, 3493.80 it/sec]
INFO - 16:14:08: 4%|▍ | 43/1000 [00:00<00:00, 3504.42 it/sec]
INFO - 16:14:08: 4%|▍ | 44/1000 [00:00<00:00, 3520.39 it/sec]
INFO - 16:14:08: 4%|▍ | 45/1000 [00:00<00:00, 3536.58 it/sec]
INFO - 16:14:08: 5%|▍ | 46/1000 [00:00<00:00, 3553.32 it/sec]
INFO - 16:14:08: 5%|▍ | 47/1000 [00:00<00:00, 3564.01 it/sec]
INFO - 16:14:08: 5%|▍ | 48/1000 [00:00<00:00, 3576.28 it/sec]
INFO - 16:14:08: 5%|▍ | 49/1000 [00:00<00:00, 3588.82 it/sec]
INFO - 16:14:08: 5%|▌ | 50/1000 [00:00<00:00, 3603.11 it/sec]
INFO - 16:14:08: 5%|▌ | 51/1000 [00:00<00:00, 3616.88 it/sec]
INFO - 16:14:08: 5%|▌ | 52/1000 [00:00<00:00, 3624.97 it/sec]
INFO - 16:14:08: 5%|▌ | 53/1000 [00:00<00:00, 3637.25 it/sec]
INFO - 16:14:08: 5%|▌ | 54/1000 [00:00<00:00, 3646.05 it/sec]
INFO - 16:14:08: 6%|▌ | 55/1000 [00:00<00:00, 3657.86 it/sec]
INFO - 16:14:08: 6%|▌ | 56/1000 [00:00<00:00, 3664.18 it/sec]
INFO - 16:14:08: 6%|▌ | 57/1000 [00:00<00:00, 3674.63 it/sec]
INFO - 16:14:08: 6%|▌ | 58/1000 [00:00<00:00, 3686.41 it/sec]
INFO - 16:14:08: 6%|▌ | 59/1000 [00:00<00:00, 3697.41 it/sec]
INFO - 16:14:08: 6%|▌ | 60/1000 [00:00<00:00, 3704.94 it/sec]
INFO - 16:14:08: 6%|▌ | 61/1000 [00:00<00:00, 3712.04 it/sec]
INFO - 16:14:08: 6%|▌ | 62/1000 [00:00<00:00, 3721.97 it/sec]
INFO - 16:14:08: 6%|▋ | 63/1000 [00:00<00:00, 3732.85 it/sec]
INFO - 16:14:08: 6%|▋ | 64/1000 [00:00<00:00, 3742.93 it/sec]
INFO - 16:14:08: 6%|▋ | 65/1000 [00:00<00:00, 3746.87 it/sec]
INFO - 16:14:08: 7%|▋ | 66/1000 [00:00<00:00, 3756.35 it/sec]
INFO - 16:14:08: 7%|▋ | 67/1000 [00:00<00:00, 3765.39 it/sec]
INFO - 16:14:08: 7%|▋ | 68/1000 [00:00<00:00, 3774.70 it/sec]
INFO - 16:14:08: 7%|▋ | 69/1000 [00:00<00:00, 3779.54 it/sec]
INFO - 16:14:08: 7%|▋ | 70/1000 [00:00<00:00, 3788.06 it/sec]
INFO - 16:14:08: 7%|▋ | 71/1000 [00:00<00:00, 3795.12 it/sec]
INFO - 16:14:08: 7%|▋ | 72/1000 [00:00<00:00, 3803.69 it/sec]
INFO - 16:14:08: 7%|▋ | 73/1000 [00:00<00:00, 3811.67 it/sec]
INFO - 16:14:08: 7%|▋ | 74/1000 [00:00<00:00, 3813.52 it/sec]
INFO - 16:14:08: 8%|▊ | 75/1000 [00:00<00:00, 3820.97 it/sec]
INFO - 16:14:08: 8%|▊ | 76/1000 [00:00<00:00, 3828.80 it/sec]
INFO - 16:14:08: 8%|▊ | 77/1000 [00:00<00:00, 3835.56 it/sec]
INFO - 16:14:08: 8%|▊ | 78/1000 [00:00<00:00, 3837.56 it/sec]
INFO - 16:14:08: 8%|▊ | 79/1000 [00:00<00:00, 3842.41 it/sec]
INFO - 16:14:08: 8%|▊ | 80/1000 [00:00<00:00, 3848.38 it/sec]
INFO - 16:14:08: 8%|▊ | 81/1000 [00:00<00:00, 3853.88 it/sec]
INFO - 16:14:08: 8%|▊ | 82/1000 [00:00<00:00, 3856.44 it/sec]
INFO - 16:14:08: 8%|▊ | 83/1000 [00:00<00:00, 3861.39 it/sec]
INFO - 16:14:08: 8%|▊ | 84/1000 [00:00<00:00, 3867.63 it/sec]
INFO - 16:14:08: 8%|▊ | 85/1000 [00:00<00:00, 3873.70 it/sec]
INFO - 16:14:08: 9%|▊ | 86/1000 [00:00<00:00, 3876.73 it/sec]
INFO - 16:14:08: 9%|▊ | 87/1000 [00:00<00:00, 3880.35 it/sec]
INFO - 16:14:08: 9%|▉ | 88/1000 [00:00<00:00, 3883.70 it/sec]
INFO - 16:14:08: 9%|▉ | 89/1000 [00:00<00:00, 3888.87 it/sec]
INFO - 16:14:08: 9%|▉ | 90/1000 [00:00<00:00, 3893.39 it/sec]
INFO - 16:14:08: 9%|▉ | 91/1000 [00:00<00:00, 3893.20 it/sec]
INFO - 16:14:08: 9%|▉ | 92/1000 [00:00<00:00, 3897.11 it/sec]
INFO - 16:14:08: 9%|▉ | 93/1000 [00:00<00:00, 3902.11 it/sec]
INFO - 16:14:08: 9%|▉ | 94/1000 [00:00<00:00, 3907.21 it/sec]
INFO - 16:14:08: 10%|▉ | 95/1000 [00:00<00:00, 3908.15 it/sec]
INFO - 16:14:08: 10%|▉ | 96/1000 [00:00<00:00, 3910.36 it/sec]
INFO - 16:14:08: 10%|▉ | 97/1000 [00:00<00:00, 3914.25 it/sec]
INFO - 16:14:08: 10%|▉ | 98/1000 [00:00<00:00, 3918.94 it/sec]
INFO - 16:14:08: 10%|▉ | 99/1000 [00:00<00:00, 3919.61 it/sec]
INFO - 16:14:08: 10%|█ | 100/1000 [00:00<00:00, 3922.62 it/sec]
INFO - 16:14:08: 10%|█ | 101/1000 [00:00<00:00, 3927.00 it/sec]
INFO - 16:14:08: 10%|█ | 102/1000 [00:00<00:00, 3931.51 it/sec]
INFO - 16:14:08: 10%|█ | 103/1000 [00:00<00:00, 3932.76 it/sec]
INFO - 16:14:08: 10%|█ | 104/1000 [00:00<00:00, 3935.44 it/sec]
INFO - 16:14:08: 10%|█ | 105/1000 [00:00<00:00, 3937.64 it/sec]
INFO - 16:14:08: 11%|█ | 106/1000 [00:00<00:00, 3940.93 it/sec]
INFO - 16:14:08: 11%|█ | 107/1000 [00:00<00:00, 3945.06 it/sec]
INFO - 16:14:08: 11%|█ | 108/1000 [00:00<00:00, 3945.76 it/sec]
INFO - 16:14:08: 11%|█ | 109/1000 [00:00<00:00, 3949.64 it/sec]
INFO - 16:14:08: 11%|█ | 110/1000 [00:00<00:00, 3953.47 it/sec]
INFO - 16:14:08: 11%|█ | 111/1000 [00:00<00:00, 3956.72 it/sec]
INFO - 16:14:08: 11%|█ | 112/1000 [00:00<00:00, 3957.49 it/sec]
INFO - 16:14:08: 11%|█▏ | 113/1000 [00:00<00:00, 3961.06 it/sec]
INFO - 16:14:08: 11%|█▏ | 114/1000 [00:00<00:00, 3964.04 it/sec]
INFO - 16:14:08: 12%|█▏ | 115/1000 [00:00<00:00, 3968.12 it/sec]
INFO - 16:14:08: 12%|█▏ | 116/1000 [00:00<00:00, 3969.22 it/sec]
INFO - 16:14:08: 12%|█▏ | 117/1000 [00:00<00:00, 3972.26 it/sec]
INFO - 16:14:08: 12%|█▏ | 118/1000 [00:00<00:00, 3975.80 it/sec]
INFO - 16:14:08: 12%|█▏ | 119/1000 [00:00<00:00, 3980.30 it/sec]
INFO - 16:14:08: 12%|█▏ | 120/1000 [00:00<00:00, 3983.45 it/sec]
INFO - 16:14:08: 12%|█▏ | 121/1000 [00:00<00:00, 3983.41 it/sec]
INFO - 16:14:08: 12%|█▏ | 122/1000 [00:00<00:00, 3986.39 it/sec]
INFO - 16:14:08: 12%|█▏ | 123/1000 [00:00<00:00, 3988.68 it/sec]
INFO - 16:14:08: 12%|█▏ | 124/1000 [00:00<00:00, 3992.34 it/sec]
INFO - 16:14:08: 12%|█▎ | 125/1000 [00:00<00:00, 3992.90 it/sec]
INFO - 16:14:08: 13%|█▎ | 126/1000 [00:00<00:00, 3995.99 it/sec]
INFO - 16:14:08: 13%|█▎ | 127/1000 [00:00<00:00, 3999.52 it/sec]
INFO - 16:14:08: 13%|█▎ | 128/1000 [00:00<00:00, 4002.20 it/sec]
INFO - 16:14:08: 13%|█▎ | 129/1000 [00:00<00:00, 3988.98 it/sec]
INFO - 16:14:08: 13%|█▎ | 130/1000 [00:00<00:00, 3990.45 it/sec]
INFO - 16:14:08: 13%|█▎ | 131/1000 [00:00<00:00, 3993.62 it/sec]
INFO - 16:14:08: 13%|█▎ | 132/1000 [00:00<00:00, 3996.05 it/sec]
INFO - 16:14:08: 13%|█▎ | 133/1000 [00:00<00:00, 3996.58 it/sec]
INFO - 16:14:08: 13%|█▎ | 134/1000 [00:00<00:00, 3999.38 it/sec]
INFO - 16:14:08: 14%|█▎ | 135/1000 [00:00<00:00, 4002.54 it/sec]
INFO - 16:14:08: 14%|█▎ | 136/1000 [00:00<00:00, 4005.21 it/sec]
INFO - 16:14:08: 14%|█▎ | 137/1000 [00:00<00:00, 4006.33 it/sec]
INFO - 16:14:08: 14%|█▍ | 138/1000 [00:00<00:00, 4008.46 it/sec]
INFO - 16:14:08: 14%|█▍ | 139/1000 [00:00<00:00, 4010.24 it/sec]
INFO - 16:14:08: 14%|█▍ | 140/1000 [00:00<00:00, 4013.14 it/sec]
INFO - 16:14:08: 14%|█▍ | 141/1000 [00:00<00:00, 4016.09 it/sec]
INFO - 16:14:08: 14%|█▍ | 142/1000 [00:00<00:00, 4015.91 it/sec]
INFO - 16:14:08: 14%|█▍ | 143/1000 [00:00<00:00, 4018.45 it/sec]
INFO - 16:14:08: 14%|█▍ | 144/1000 [00:00<00:00, 4020.61 it/sec]
INFO - 16:14:08: 14%|█▍ | 145/1000 [00:00<00:00, 4023.41 it/sec]
INFO - 16:14:08: 15%|█▍ | 146/1000 [00:00<00:00, 4023.97 it/sec]
INFO - 16:14:08: 15%|█▍ | 147/1000 [00:00<00:00, 4026.40 it/sec]
INFO - 16:14:08: 15%|█▍ | 148/1000 [00:00<00:00, 4028.72 it/sec]
INFO - 16:14:08: 15%|█▍ | 149/1000 [00:00<00:00, 4031.55 it/sec]
INFO - 16:14:08: 15%|█▌ | 150/1000 [00:00<00:00, 4031.90 it/sec]
INFO - 16:14:08: 15%|█▌ | 151/1000 [00:00<00:00, 4033.81 it/sec]
INFO - 16:14:08: 15%|█▌ | 152/1000 [00:00<00:00, 4036.43 it/sec]
INFO - 16:14:08: 15%|█▌ | 153/1000 [00:00<00:00, 4038.90 it/sec]
INFO - 16:14:08: 15%|█▌ | 154/1000 [00:00<00:00, 4041.82 it/sec]
INFO - 16:14:08: 16%|█▌ | 155/1000 [00:00<00:00, 4041.71 it/sec]
INFO - 16:14:08: 16%|█▌ | 156/1000 [00:00<00:00, 4044.28 it/sec]
INFO - 16:14:08: 16%|█▌ | 157/1000 [00:00<00:00, 4045.92 it/sec]
INFO - 16:14:08: 16%|█▌ | 158/1000 [00:00<00:00, 4047.81 it/sec]
INFO - 16:14:08: 16%|█▌ | 159/1000 [00:00<00:00, 4048.48 it/sec]
INFO - 16:14:08: 16%|█▌ | 160/1000 [00:00<00:00, 4050.39 it/sec]
INFO - 16:14:08: 16%|█▌ | 161/1000 [00:00<00:00, 4052.52 it/sec]
INFO - 16:14:08: 16%|█▌ | 162/1000 [00:00<00:00, 4054.62 it/sec]
INFO - 16:14:08: 16%|█▋ | 163/1000 [00:00<00:00, 4054.73 it/sec]
INFO - 16:14:08: 16%|█▋ | 164/1000 [00:00<00:00, 4056.03 it/sec]
INFO - 16:14:08: 16%|█▋ | 165/1000 [00:00<00:00, 4058.10 it/sec]
INFO - 16:14:08: 17%|█▋ | 166/1000 [00:00<00:00, 4060.12 it/sec]
INFO - 16:14:08: 17%|█▋ | 167/1000 [00:00<00:00, 4061.82 it/sec]
INFO - 16:14:08: 17%|█▋ | 168/1000 [00:00<00:00, 4061.23 it/sec]
INFO - 16:14:08: 17%|█▋ | 169/1000 [00:00<00:00, 4062.29 it/sec]
INFO - 16:14:08: 17%|█▋ | 170/1000 [00:00<00:00, 4063.62 it/sec]
INFO - 16:14:08: 17%|█▋ | 171/1000 [00:00<00:00, 4065.24 it/sec]
INFO - 16:14:08: 17%|█▋ | 172/1000 [00:00<00:00, 4065.19 it/sec]
INFO - 16:14:08: 17%|█▋ | 173/1000 [00:00<00:00, 4066.80 it/sec]
INFO - 16:14:08: 17%|█▋ | 174/1000 [00:00<00:00, 4067.94 it/sec]
INFO - 16:14:08: 18%|█▊ | 175/1000 [00:00<00:00, 4069.77 it/sec]
INFO - 16:14:08: 18%|█▊ | 176/1000 [00:00<00:00, 4069.56 it/sec]
INFO - 16:14:08: 18%|█▊ | 177/1000 [00:00<00:00, 4071.16 it/sec]
INFO - 16:14:08: 18%|█▊ | 178/1000 [00:00<00:00, 4073.12 it/sec]
INFO - 16:14:08: 18%|█▊ | 179/1000 [00:00<00:00, 4075.41 it/sec]
INFO - 16:14:08: 18%|█▊ | 180/1000 [00:00<00:00, 4077.00 it/sec]
INFO - 16:14:08: 18%|█▊ | 181/1000 [00:00<00:00, 4076.51 it/sec]
INFO - 16:14:08: 18%|█▊ | 182/1000 [00:00<00:00, 4078.21 it/sec]
INFO - 16:14:08: 18%|█▊ | 183/1000 [00:00<00:00, 4080.02 it/sec]
INFO - 16:14:08: 18%|█▊ | 184/1000 [00:00<00:00, 4082.05 it/sec]
INFO - 16:14:08: 18%|█▊ | 185/1000 [00:00<00:00, 4081.84 it/sec]
INFO - 16:14:08: 19%|█▊ | 186/1000 [00:00<00:00, 4083.05 it/sec]
INFO - 16:14:08: 19%|█▊ | 187/1000 [00:00<00:00, 4083.84 it/sec]
INFO - 16:14:08: 19%|█▉ | 188/1000 [00:00<00:00, 4085.85 it/sec]
INFO - 16:14:08: 19%|█▉ | 189/1000 [00:00<00:00, 4085.63 it/sec]
INFO - 16:14:08: 19%|█▉ | 190/1000 [00:00<00:00, 4087.22 it/sec]
INFO - 16:14:08: 19%|█▉ | 191/1000 [00:00<00:00, 4088.37 it/sec]
INFO - 16:14:08: 19%|█▉ | 192/1000 [00:00<00:00, 4090.15 it/sec]
INFO - 16:14:08: 19%|█▉ | 193/1000 [00:00<00:00, 4090.41 it/sec]
INFO - 16:14:08: 19%|█▉ | 194/1000 [00:00<00:00, 4091.30 it/sec]
INFO - 16:14:08: 20%|█▉ | 195/1000 [00:00<00:00, 4093.11 it/sec]
INFO - 16:14:08: 20%|█▉ | 196/1000 [00:00<00:00, 4094.94 it/sec]
INFO - 16:14:08: 20%|█▉ | 197/1000 [00:00<00:00, 4096.85 it/sec]
INFO - 16:14:08: 20%|█▉ | 198/1000 [00:00<00:00, 4096.95 it/sec]
INFO - 16:14:08: 20%|█▉ | 199/1000 [00:00<00:00, 4098.37 it/sec]
INFO - 16:14:08: 20%|██ | 200/1000 [00:00<00:00, 4100.30 it/sec]
INFO - 16:14:08: 20%|██ | 201/1000 [00:00<00:00, 4101.92 it/sec]
INFO - 16:14:08: 20%|██ | 202/1000 [00:00<00:00, 4101.93 it/sec]
INFO - 16:14:08: 20%|██ | 203/1000 [00:00<00:00, 4102.99 it/sec]
INFO - 16:14:08: 20%|██ | 204/1000 [00:00<00:00, 4104.72 it/sec]
INFO - 16:14:08: 20%|██ | 205/1000 [00:00<00:00, 4106.78 it/sec]
INFO - 16:14:08: 21%|██ | 206/1000 [00:00<00:00, 4108.64 it/sec]
INFO - 16:14:08: 21%|██ | 207/1000 [00:00<00:00, 4108.23 it/sec]
INFO - 16:14:08: 21%|██ | 208/1000 [00:00<00:00, 4109.84 it/sec]
INFO - 16:14:08: 21%|██ | 209/1000 [00:00<00:00, 4110.85 it/sec]
INFO - 16:14:08: 21%|██ | 210/1000 [00:00<00:00, 4112.64 it/sec]
INFO - 16:14:08: 21%|██ | 211/1000 [00:00<00:00, 4112.64 it/sec]
INFO - 16:14:08: 21%|██ | 212/1000 [00:00<00:00, 4114.02 it/sec]
INFO - 16:14:08: 21%|██▏ | 213/1000 [00:00<00:00, 4115.70 it/sec]
INFO - 16:14:08: 21%|██▏ | 214/1000 [00:00<00:00, 4117.38 it/sec]
INFO - 16:14:08: 22%|██▏ | 215/1000 [00:00<00:00, 4105.34 it/sec]
INFO - 16:14:08: 22%|██▏ | 216/1000 [00:00<00:00, 4105.58 it/sec]
INFO - 16:14:08: 22%|██▏ | 217/1000 [00:00<00:00, 4106.98 it/sec]
INFO - 16:14:08: 22%|██▏ | 218/1000 [00:00<00:00, 4108.77 it/sec]
INFO - 16:14:08: 22%|██▏ | 219/1000 [00:00<00:00, 4108.92 it/sec]
INFO - 16:14:08: 22%|██▏ | 220/1000 [00:00<00:00, 4109.74 it/sec]
INFO - 16:14:08: 22%|██▏ | 221/1000 [00:00<00:00, 4110.99 it/sec]
INFO - 16:14:08: 22%|██▏ | 222/1000 [00:00<00:00, 4112.68 it/sec]
INFO - 16:14:08: 22%|██▏ | 223/1000 [00:00<00:00, 4112.91 it/sec]
INFO - 16:14:08: 22%|██▏ | 224/1000 [00:00<00:00, 4114.26 it/sec]
INFO - 16:14:08: 22%|██▎ | 225/1000 [00:00<00:00, 4115.52 it/sec]
INFO - 16:14:08: 23%|██▎ | 226/1000 [00:00<00:00, 4117.14 it/sec]
INFO - 16:14:08: 23%|██▎ | 227/1000 [00:00<00:00, 4118.93 it/sec]
INFO - 16:14:08: 23%|██▎ | 228/1000 [00:00<00:00, 4119.02 it/sec]
INFO - 16:14:08: 23%|██▎ | 229/1000 [00:00<00:00, 4120.72 it/sec]
INFO - 16:14:08: 23%|██▎ | 230/1000 [00:00<00:00, 4122.54 it/sec]
INFO - 16:14:08: 23%|██▎ | 231/1000 [00:00<00:00, 4124.16 it/sec]
INFO - 16:14:08: 23%|██▎ | 232/1000 [00:00<00:00, 4124.32 it/sec]
INFO - 16:14:08: 23%|██▎ | 233/1000 [00:00<00:00, 4125.12 it/sec]
INFO - 16:14:08: 23%|██▎ | 234/1000 [00:00<00:00, 4126.83 it/sec]
INFO - 16:14:08: 24%|██▎ | 235/1000 [00:00<00:00, 4128.55 it/sec]
INFO - 16:14:08: 24%|██▎ | 236/1000 [00:00<00:00, 4130.32 it/sec]
INFO - 16:14:08: 24%|██▎ | 237/1000 [00:00<00:00, 4130.16 it/sec]
INFO - 16:14:08: 24%|██▍ | 238/1000 [00:00<00:00, 4131.69 it/sec]
INFO - 16:14:08: 24%|██▍ | 239/1000 [00:00<00:00, 4133.36 it/sec]
INFO - 16:14:08: 24%|██▍ | 240/1000 [00:00<00:00, 4135.07 it/sec]
INFO - 16:14:08: 24%|██▍ | 241/1000 [00:00<00:00, 4134.97 it/sec]
INFO - 16:14:08: 24%|██▍ | 242/1000 [00:00<00:00, 4135.97 it/sec]
INFO - 16:14:08: 24%|██▍ | 243/1000 [00:00<00:00, 4129.54 it/sec]
INFO - 16:14:08: 24%|██▍ | 244/1000 [00:00<00:00, 4130.35 it/sec]
INFO - 16:14:08: 24%|██▍ | 245/1000 [00:00<00:00, 4130.21 it/sec]
INFO - 16:14:08: 25%|██▍ | 246/1000 [00:00<00:00, 4130.91 it/sec]
INFO - 16:14:08: 25%|██▍ | 247/1000 [00:00<00:00, 4131.50 it/sec]
INFO - 16:14:08: 25%|██▍ | 248/1000 [00:00<00:00, 4132.86 it/sec]
INFO - 16:14:08: 25%|██▍ | 249/1000 [00:00<00:00, 4133.02 it/sec]
INFO - 16:14:08: 25%|██▌ | 250/1000 [00:00<00:00, 4134.06 it/sec]
INFO - 16:14:08: 25%|██▌ | 251/1000 [00:00<00:00, 4135.61 it/sec]
INFO - 16:14:08: 25%|██▌ | 252/1000 [00:00<00:00, 4136.85 it/sec]
INFO - 16:14:08: 25%|██▌ | 253/1000 [00:00<00:00, 4137.86 it/sec]
INFO - 16:14:08: 25%|██▌ | 254/1000 [00:00<00:00, 4137.54 it/sec]
INFO - 16:14:08: 26%|██▌ | 255/1000 [00:00<00:00, 4138.86 it/sec]
INFO - 16:14:08: 26%|██▌ | 256/1000 [00:00<00:00, 4139.82 it/sec]
INFO - 16:14:08: 26%|██▌ | 257/1000 [00:00<00:00, 4141.03 it/sec]
INFO - 16:14:08: 26%|██▌ | 258/1000 [00:00<00:00, 4140.70 it/sec]
INFO - 16:14:08: 26%|██▌ | 259/1000 [00:00<00:00, 4141.57 it/sec]
INFO - 16:14:08: 26%|██▌ | 260/1000 [00:00<00:00, 4142.10 it/sec]
INFO - 16:14:08: 26%|██▌ | 261/1000 [00:00<00:00, 4143.14 it/sec]
INFO - 16:14:08: 26%|██▌ | 262/1000 [00:00<00:00, 4142.60 it/sec]
INFO - 16:14:08: 26%|██▋ | 263/1000 [00:00<00:00, 4142.98 it/sec]
INFO - 16:14:08: 26%|██▋ | 264/1000 [00:00<00:00, 4143.73 it/sec]
INFO - 16:14:08: 26%|██▋ | 265/1000 [00:00<00:00, 4144.46 it/sec]
INFO - 16:14:08: 27%|██▋ | 266/1000 [00:00<00:00, 4144.12 it/sec]
INFO - 16:14:08: 27%|██▋ | 267/1000 [00:00<00:00, 4144.40 it/sec]
INFO - 16:14:08: 27%|██▋ | 268/1000 [00:00<00:00, 4145.43 it/sec]
INFO - 16:14:08: 27%|██▋ | 269/1000 [00:00<00:00, 4146.20 it/sec]
INFO - 16:14:08: 27%|██▋ | 270/1000 [00:00<00:00, 4147.15 it/sec]
INFO - 16:14:08: 27%|██▋ | 271/1000 [00:00<00:00, 4146.70 it/sec]
INFO - 16:14:08: 27%|██▋ | 272/1000 [00:00<00:00, 4147.60 it/sec]
INFO - 16:14:08: 27%|██▋ | 273/1000 [00:00<00:00, 4148.31 it/sec]
INFO - 16:14:08: 27%|██▋ | 274/1000 [00:00<00:00, 4148.79 it/sec]
INFO - 16:14:08: 28%|██▊ | 275/1000 [00:00<00:00, 4148.44 it/sec]
INFO - 16:14:08: 28%|██▊ | 276/1000 [00:00<00:00, 4148.92 it/sec]
INFO - 16:14:08: 28%|██▊ | 277/1000 [00:00<00:00, 4149.25 it/sec]
INFO - 16:14:08: 28%|██▊ | 278/1000 [00:00<00:00, 4149.88 it/sec]
INFO - 16:14:08: 28%|██▊ | 279/1000 [00:00<00:00, 4149.48 it/sec]
INFO - 16:14:08: 28%|██▊ | 280/1000 [00:00<00:00, 4150.25 it/sec]
INFO - 16:14:08: 28%|██▊ | 281/1000 [00:00<00:00, 4150.89 it/sec]
INFO - 16:14:08: 28%|██▊ | 282/1000 [00:00<00:00, 4151.84 it/sec]
INFO - 16:14:08: 28%|██▊ | 283/1000 [00:00<00:00, 4152.95 it/sec]
INFO - 16:14:08: 28%|██▊ | 284/1000 [00:00<00:00, 4152.20 it/sec]
INFO - 16:14:08: 28%|██▊ | 285/1000 [00:00<00:00, 4152.75 it/sec]
INFO - 16:14:08: 29%|██▊ | 286/1000 [00:00<00:00, 4153.29 it/sec]
INFO - 16:14:08: 29%|██▊ | 287/1000 [00:00<00:00, 4154.32 it/sec]
INFO - 16:14:08: 29%|██▉ | 288/1000 [00:00<00:00, 4154.28 it/sec]
INFO - 16:14:08: 29%|██▉ | 289/1000 [00:00<00:00, 4155.10 it/sec]
INFO - 16:14:08: 29%|██▉ | 290/1000 [00:00<00:00, 4155.97 it/sec]
INFO - 16:14:08: 29%|██▉ | 291/1000 [00:00<00:00, 4156.27 it/sec]
INFO - 16:14:08: 29%|██▉ | 292/1000 [00:00<00:00, 4155.74 it/sec]
INFO - 16:14:08: 29%|██▉ | 293/1000 [00:00<00:00, 4156.25 it/sec]
INFO - 16:14:08: 29%|██▉ | 294/1000 [00:00<00:00, 4156.60 it/sec]
INFO - 16:14:08: 30%|██▉ | 295/1000 [00:00<00:00, 4157.35 it/sec]
INFO - 16:14:08: 30%|██▉ | 296/1000 [00:00<00:00, 4157.06 it/sec]
INFO - 16:14:08: 30%|██▉ | 297/1000 [00:00<00:00, 4157.35 it/sec]
INFO - 16:14:08: 30%|██▉ | 298/1000 [00:00<00:00, 4158.27 it/sec]
INFO - 16:14:08: 30%|██▉ | 299/1000 [00:00<00:00, 4159.32 it/sec]
INFO - 16:14:08: 30%|███ | 300/1000 [00:00<00:00, 4160.37 it/sec]
INFO - 16:14:08: 30%|███ | 301/1000 [00:00<00:00, 4159.51 it/sec]
INFO - 16:14:08: 30%|███ | 302/1000 [00:00<00:00, 4160.37 it/sec]
INFO - 16:14:08: 30%|███ | 303/1000 [00:00<00:00, 4161.03 it/sec]
INFO - 16:14:08: 30%|███ | 304/1000 [00:00<00:00, 4161.45 it/sec]
INFO - 16:14:08: 30%|███ | 305/1000 [00:00<00:00, 4161.08 it/sec]
INFO - 16:14:08: 31%|███ | 306/1000 [00:00<00:00, 4161.49 it/sec]
INFO - 16:14:08: 31%|███ | 307/1000 [00:00<00:00, 4162.08 it/sec]
INFO - 16:14:08: 31%|███ | 308/1000 [00:00<00:00, 4162.80 it/sec]
INFO - 16:14:08: 31%|███ | 309/1000 [00:00<00:00, 4162.30 it/sec]
INFO - 16:14:08: 31%|███ | 310/1000 [00:00<00:00, 4162.72 it/sec]
INFO - 16:14:08: 31%|███ | 311/1000 [00:00<00:00, 4162.89 it/sec]
INFO - 16:14:08: 31%|███ | 312/1000 [00:00<00:00, 4163.64 it/sec]
INFO - 16:14:08: 31%|███▏ | 313/1000 [00:00<00:00, 4164.54 it/sec]
INFO - 16:14:08: 31%|███▏ | 314/1000 [00:00<00:00, 4163.55 it/sec]
INFO - 16:14:08: 32%|███▏ | 315/1000 [00:00<00:00, 4164.01 it/sec]
INFO - 16:14:08: 32%|███▏ | 316/1000 [00:00<00:00, 4164.65 it/sec]
INFO - 16:14:08: 32%|███▏ | 317/1000 [00:00<00:00, 4165.27 it/sec]
INFO - 16:14:08: 32%|███▏ | 318/1000 [00:00<00:00, 4164.46 it/sec]
INFO - 16:14:08: 32%|███▏ | 319/1000 [00:00<00:00, 4165.21 it/sec]
INFO - 16:14:08: 32%|███▏ | 320/1000 [00:00<00:00, 4166.03 it/sec]
INFO - 16:14:08: 32%|███▏ | 321/1000 [00:00<00:00, 4166.68 it/sec]
INFO - 16:14:08: 32%|███▏ | 322/1000 [00:00<00:00, 4166.32 it/sec]
INFO - 16:14:08: 32%|███▏ | 323/1000 [00:00<00:00, 4166.97 it/sec]
INFO - 16:14:08: 32%|███▏ | 324/1000 [00:00<00:00, 4167.57 it/sec]
INFO - 16:14:08: 32%|███▎ | 325/1000 [00:00<00:00, 4168.42 it/sec]
INFO - 16:14:08: 33%|███▎ | 326/1000 [00:00<00:00, 4168.23 it/sec]
INFO - 16:14:08: 33%|███▎ | 327/1000 [00:00<00:00, 4168.77 it/sec]
INFO - 16:14:08: 33%|███▎ | 328/1000 [00:00<00:00, 4168.80 it/sec]
INFO - 16:14:08: 33%|███▎ | 329/1000 [00:00<00:00, 4166.61 it/sec]
INFO - 16:14:08: 33%|███▎ | 330/1000 [00:00<00:00, 4165.51 it/sec]
INFO - 16:14:08: 33%|███▎ | 331/1000 [00:00<00:00, 4165.56 it/sec]
INFO - 16:14:08: 33%|███▎ | 332/1000 [00:00<00:00, 4165.98 it/sec]
INFO - 16:14:08: 33%|███▎ | 333/1000 [00:00<00:00, 4166.83 it/sec]
INFO - 16:14:08: 33%|███▎ | 334/1000 [00:00<00:00, 4167.69 it/sec]
INFO - 16:14:08: 34%|███▎ | 335/1000 [00:00<00:00, 4167.01 it/sec]
INFO - 16:14:08: 34%|███▎ | 336/1000 [00:00<00:00, 4167.44 it/sec]
INFO - 16:14:08: 34%|███▎ | 337/1000 [00:00<00:00, 4168.21 it/sec]
INFO - 16:14:08: 34%|███▍ | 338/1000 [00:00<00:00, 4169.21 it/sec]
INFO - 16:14:08: 34%|███▍ | 339/1000 [00:00<00:00, 4169.08 it/sec]
INFO - 16:14:08: 34%|███▍ | 340/1000 [00:00<00:00, 4169.51 it/sec]
INFO - 16:14:08: 34%|███▍ | 341/1000 [00:00<00:00, 4170.41 it/sec]
INFO - 16:14:08: 34%|███▍ | 342/1000 [00:00<00:00, 4170.86 it/sec]
INFO - 16:14:08: 34%|███▍ | 343/1000 [00:00<00:00, 4170.86 it/sec]
INFO - 16:14:08: 34%|███▍ | 344/1000 [00:00<00:00, 4171.29 it/sec]
INFO - 16:14:08: 34%|███▍ | 345/1000 [00:00<00:00, 4171.48 it/sec]
INFO - 16:14:08: 35%|███▍ | 346/1000 [00:00<00:00, 4172.22 it/sec]
INFO - 16:14:08: 35%|███▍ | 347/1000 [00:00<00:00, 4173.17 it/sec]
INFO - 16:14:08: 35%|███▍ | 348/1000 [00:00<00:00, 4172.48 it/sec]
INFO - 16:14:08: 35%|███▍ | 349/1000 [00:00<00:00, 4173.19 it/sec]
INFO - 16:14:08: 35%|███▌ | 350/1000 [00:00<00:00, 4174.29 it/sec]
INFO - 16:14:08: 35%|███▌ | 351/1000 [00:00<00:00, 4175.32 it/sec]
INFO - 16:14:08: 35%|███▌ | 352/1000 [00:00<00:00, 4175.11 it/sec]
INFO - 16:14:08: 35%|███▌ | 353/1000 [00:00<00:00, 4175.41 it/sec]
INFO - 16:14:08: 35%|███▌ | 354/1000 [00:00<00:00, 4176.28 it/sec]
INFO - 16:14:08: 36%|███▌ | 355/1000 [00:00<00:00, 4177.29 it/sec]
INFO - 16:14:08: 36%|███▌ | 356/1000 [00:00<00:00, 4177.16 it/sec]
INFO - 16:14:08: 36%|███▌ | 357/1000 [00:00<00:00, 4171.66 it/sec]
INFO - 16:14:08: 36%|███▌ | 358/1000 [00:00<00:00, 4171.60 it/sec]
INFO - 16:14:08: 36%|███▌ | 359/1000 [00:00<00:00, 4172.20 it/sec]
INFO - 16:14:08: 36%|███▌ | 360/1000 [00:00<00:00, 4171.83 it/sec]
INFO - 16:14:08: 36%|███▌ | 361/1000 [00:00<00:00, 4172.07 it/sec]
INFO - 16:14:08: 36%|███▌ | 362/1000 [00:00<00:00, 4172.40 it/sec]
INFO - 16:14:08: 36%|███▋ | 363/1000 [00:00<00:00, 4172.84 it/sec]
INFO - 16:14:08: 36%|███▋ | 364/1000 [00:00<00:00, 4172.71 it/sec]
INFO - 16:14:08: 36%|███▋ | 365/1000 [00:00<00:00, 4172.69 it/sec]
INFO - 16:14:08: 37%|███▋ | 366/1000 [00:00<00:00, 4173.19 it/sec]
INFO - 16:14:08: 37%|███▋ | 367/1000 [00:00<00:00, 4174.15 it/sec]
INFO - 16:14:08: 37%|███▋ | 368/1000 [00:00<00:00, 4174.77 it/sec]
INFO - 16:14:08: 37%|███▋ | 369/1000 [00:00<00:00, 4174.06 it/sec]
INFO - 16:14:08: 37%|███▋ | 370/1000 [00:00<00:00, 4174.17 it/sec]
INFO - 16:14:08: 37%|███▋ | 371/1000 [00:00<00:00, 4174.53 it/sec]
INFO - 16:14:08: 37%|███▋ | 372/1000 [00:00<00:00, 4175.17 it/sec]
INFO - 16:14:08: 37%|███▋ | 373/1000 [00:00<00:00, 4174.62 it/sec]
INFO - 16:14:08: 37%|███▋ | 374/1000 [00:00<00:00, 4174.77 it/sec]
INFO - 16:14:08: 38%|███▊ | 375/1000 [00:00<00:00, 4175.36 it/sec]
INFO - 16:14:08: 38%|███▊ | 376/1000 [00:00<00:00, 4176.04 it/sec]
INFO - 16:14:08: 38%|███▊ | 377/1000 [00:00<00:00, 4175.80 it/sec]
INFO - 16:14:08: 38%|███▊ | 378/1000 [00:00<00:00, 4175.97 it/sec]
INFO - 16:14:08: 38%|███▊ | 379/1000 [00:00<00:00, 4175.89 it/sec]
INFO - 16:14:08: 38%|███▊ | 380/1000 [00:00<00:00, 4176.41 it/sec]
INFO - 16:14:08: 38%|███▊ | 381/1000 [00:00<00:00, 4176.11 it/sec]
INFO - 16:14:08: 38%|███▊ | 382/1000 [00:00<00:00, 4176.23 it/sec]
INFO - 16:14:08: 38%|███▊ | 383/1000 [00:00<00:00, 4176.64 it/sec]
INFO - 16:14:08: 38%|███▊ | 384/1000 [00:00<00:00, 4177.31 it/sec]
INFO - 16:14:08: 38%|███▊ | 385/1000 [00:00<00:00, 4178.05 it/sec]
INFO - 16:14:08: 39%|███▊ | 386/1000 [00:00<00:00, 4177.21 it/sec]
INFO - 16:14:08: 39%|███▊ | 387/1000 [00:00<00:00, 4177.57 it/sec]
INFO - 16:14:08: 39%|███▉ | 388/1000 [00:00<00:00, 4178.34 it/sec]
INFO - 16:14:08: 39%|███▉ | 389/1000 [00:00<00:00, 4179.12 it/sec]
INFO - 16:14:08: 39%|███▉ | 390/1000 [00:00<00:00, 4178.70 it/sec]
INFO - 16:14:08: 39%|███▉ | 391/1000 [00:00<00:00, 4178.84 it/sec]
INFO - 16:14:08: 39%|███▉ | 392/1000 [00:00<00:00, 4179.47 it/sec]
INFO - 16:14:08: 39%|███▉ | 393/1000 [00:00<00:00, 4179.97 it/sec]
INFO - 16:14:08: 39%|███▉ | 394/1000 [00:00<00:00, 4179.62 it/sec]
INFO - 16:14:08: 40%|███▉ | 395/1000 [00:00<00:00, 4179.80 it/sec]
INFO - 16:14:08: 40%|███▉ | 396/1000 [00:00<00:00, 4179.75 it/sec]
INFO - 16:14:08: 40%|███▉ | 397/1000 [00:00<00:00, 4180.16 it/sec]
INFO - 16:14:08: 40%|███▉ | 398/1000 [00:00<00:00, 4179.73 it/sec]
INFO - 16:14:08: 40%|███▉ | 399/1000 [00:00<00:00, 4179.75 it/sec]
INFO - 16:14:08: 40%|████ | 400/1000 [00:00<00:00, 4180.07 it/sec]
INFO - 16:14:08: 40%|████ | 401/1000 [00:00<00:00, 4180.68 it/sec]
INFO - 16:14:08: 40%|████ | 402/1000 [00:00<00:00, 4181.31 it/sec]
INFO - 16:14:08: 40%|████ | 403/1000 [00:00<00:00, 4180.63 it/sec]
INFO - 16:14:08: 40%|████ | 404/1000 [00:00<00:00, 4180.93 it/sec]
INFO - 16:14:08: 40%|████ | 405/1000 [00:00<00:00, 4181.72 it/sec]
INFO - 16:14:08: 41%|████ | 406/1000 [00:00<00:00, 4182.29 it/sec]
INFO - 16:14:08: 41%|████ | 407/1000 [00:00<00:00, 4181.90 it/sec]
INFO - 16:14:08: 41%|████ | 408/1000 [00:00<00:00, 4181.65 it/sec]
INFO - 16:14:08: 41%|████ | 409/1000 [00:00<00:00, 4182.15 it/sec]
INFO - 16:14:08: 41%|████ | 410/1000 [00:00<00:00, 4182.78 it/sec]
INFO - 16:14:08: 41%|████ | 411/1000 [00:00<00:00, 4182.46 it/sec]
INFO - 16:14:08: 41%|████ | 412/1000 [00:00<00:00, 4182.57 it/sec]
INFO - 16:14:08: 41%|████▏ | 413/1000 [00:00<00:00, 4182.47 it/sec]
INFO - 16:14:08: 41%|████▏ | 414/1000 [00:00<00:00, 4182.81 it/sec]
INFO - 16:14:08: 42%|████▏ | 415/1000 [00:00<00:00, 4182.56 it/sec]
INFO - 16:14:08: 42%|████▏ | 416/1000 [00:00<00:00, 4182.78 it/sec]
INFO - 16:14:08: 42%|████▏ | 417/1000 [00:00<00:00, 4183.18 it/sec]
INFO - 16:14:08: 42%|████▏ | 418/1000 [00:00<00:00, 4183.90 it/sec]
INFO - 16:14:08: 42%|████▏ | 419/1000 [00:00<00:00, 4184.65 it/sec]
INFO - 16:14:08: 42%|████▏ | 420/1000 [00:00<00:00, 4184.06 it/sec]
INFO - 16:14:08: 42%|████▏ | 421/1000 [00:00<00:00, 4184.47 it/sec]
INFO - 16:14:08: 42%|████▏ | 422/1000 [00:00<00:00, 4185.25 it/sec]
INFO - 16:14:08: 42%|████▏ | 423/1000 [00:00<00:00, 4185.98 it/sec]
INFO - 16:14:08: 42%|████▏ | 424/1000 [00:00<00:00, 4185.78 it/sec]
INFO - 16:14:08: 42%|████▎ | 425/1000 [00:00<00:00, 4186.12 it/sec]
INFO - 16:14:08: 43%|████▎ | 426/1000 [00:00<00:00, 4186.69 it/sec]
INFO - 16:14:08: 43%|████▎ | 427/1000 [00:00<00:00, 4187.18 it/sec]
INFO - 16:14:08: 43%|████▎ | 428/1000 [00:00<00:00, 4187.13 it/sec]
INFO - 16:14:08: 43%|████▎ | 429/1000 [00:00<00:00, 4187.40 it/sec]
INFO - 16:14:08: 43%|████▎ | 430/1000 [00:00<00:00, 4187.59 it/sec]
INFO - 16:14:08: 43%|████▎ | 431/1000 [00:00<00:00, 4188.29 it/sec]
INFO - 16:14:08: 43%|████▎ | 432/1000 [00:00<00:00, 4188.87 it/sec]
INFO - 16:14:08: 43%|████▎ | 433/1000 [00:00<00:00, 4188.26 it/sec]
INFO - 16:14:08: 43%|████▎ | 434/1000 [00:00<00:00, 4188.59 it/sec]
INFO - 16:14:08: 44%|████▎ | 435/1000 [00:00<00:00, 4189.33 it/sec]
INFO - 16:14:08: 44%|████▎ | 436/1000 [00:00<00:00, 4189.86 it/sec]
INFO - 16:14:08: 44%|████▎ | 437/1000 [00:00<00:00, 4189.57 it/sec]
INFO - 16:14:08: 44%|████▍ | 438/1000 [00:00<00:00, 4189.90 it/sec]
INFO - 16:14:08: 44%|████▍ | 439/1000 [00:00<00:00, 4190.56 it/sec]
INFO - 16:14:08: 44%|████▍ | 440/1000 [00:00<00:00, 4191.26 it/sec]
INFO - 16:14:08: 44%|████▍ | 441/1000 [00:00<00:00, 4191.09 it/sec]
INFO - 16:14:08: 44%|████▍ | 442/1000 [00:00<00:00, 4191.23 it/sec]
INFO - 16:14:08: 44%|████▍ | 443/1000 [00:00<00:00, 4191.44 it/sec]
INFO - 16:14:08: 44%|████▍ | 444/1000 [00:00<00:00, 4191.83 it/sec]
INFO - 16:14:08: 44%|████▍ | 445/1000 [00:00<00:00, 4192.27 it/sec]
INFO - 16:14:08: 45%|████▍ | 446/1000 [00:00<00:00, 4191.47 it/sec]
INFO - 16:14:08: 45%|████▍ | 447/1000 [00:00<00:00, 4191.50 it/sec]
INFO - 16:14:08: 45%|████▍ | 448/1000 [00:00<00:00, 4191.94 it/sec]
INFO - 16:14:08: 45%|████▍ | 449/1000 [00:00<00:00, 4192.32 it/sec]
INFO - 16:14:08: 45%|████▌ | 450/1000 [00:00<00:00, 4191.74 it/sec]
INFO - 16:14:08: 45%|████▌ | 451/1000 [00:00<00:00, 4191.92 it/sec]
INFO - 16:14:08: 45%|████▌ | 452/1000 [00:00<00:00, 4192.49 it/sec]
INFO - 16:14:08: 45%|████▌ | 453/1000 [00:00<00:00, 4192.70 it/sec]
INFO - 16:14:08: 45%|████▌ | 454/1000 [00:00<00:00, 4192.32 it/sec]
INFO - 16:14:08: 46%|████▌ | 455/1000 [00:00<00:00, 4192.46 it/sec]
INFO - 16:14:08: 46%|████▌ | 456/1000 [00:00<00:00, 4193.04 it/sec]
INFO - 16:14:08: 46%|████▌ | 457/1000 [00:00<00:00, 4193.47 it/sec]
INFO - 16:14:08: 46%|████▌ | 458/1000 [00:00<00:00, 4193.26 it/sec]
INFO - 16:14:08: 46%|████▌ | 459/1000 [00:00<00:00, 4193.34 it/sec]
INFO - 16:14:08: 46%|████▌ | 460/1000 [00:00<00:00, 4193.88 it/sec]
INFO - 16:14:08: 46%|████▌ | 461/1000 [00:00<00:00, 4194.39 it/sec]
INFO - 16:14:08: 46%|████▌ | 462/1000 [00:00<00:00, 4194.88 it/sec]
INFO - 16:14:08: 46%|████▋ | 463/1000 [00:00<00:00, 4194.17 it/sec]
INFO - 16:14:08: 46%|████▋ | 464/1000 [00:00<00:00, 4194.39 it/sec]
INFO - 16:14:08: 46%|████▋ | 465/1000 [00:00<00:00, 4194.63 it/sec]
INFO - 16:14:08: 47%|████▋ | 466/1000 [00:00<00:00, 4195.20 it/sec]
INFO - 16:14:08: 47%|████▋ | 467/1000 [00:00<00:00, 4194.91 it/sec]
INFO - 16:14:08: 47%|████▋ | 468/1000 [00:00<00:00, 4195.09 it/sec]
INFO - 16:14:08: 47%|████▋ | 469/1000 [00:00<00:00, 4195.37 it/sec]
INFO - 16:14:08: 47%|████▋ | 470/1000 [00:00<00:00, 4195.78 it/sec]
INFO - 16:14:08: 47%|████▋ | 471/1000 [00:00<00:00, 4190.34 it/sec]
INFO - 16:14:08: 47%|████▋ | 472/1000 [00:00<00:00, 4190.11 it/sec]
INFO - 16:14:08: 47%|████▋ | 473/1000 [00:00<00:00, 4190.42 it/sec]
INFO - 16:14:08: 47%|████▋ | 474/1000 [00:00<00:00, 4190.84 it/sec]
INFO - 16:14:08: 48%|████▊ | 475/1000 [00:00<00:00, 4190.11 it/sec]
INFO - 16:14:08: 48%|████▊ | 476/1000 [00:00<00:00, 4190.32 it/sec]
INFO - 16:14:08: 48%|████▊ | 477/1000 [00:00<00:00, 4190.69 it/sec]
INFO - 16:14:08: 48%|████▊ | 478/1000 [00:00<00:00, 4190.97 it/sec]
INFO - 16:14:08: 48%|████▊ | 479/1000 [00:00<00:00, 4190.47 it/sec]
INFO - 16:14:08: 48%|████▊ | 480/1000 [00:00<00:00, 4190.67 it/sec]
INFO - 16:14:08: 48%|████▊ | 481/1000 [00:00<00:00, 4190.66 it/sec]
INFO - 16:14:08: 48%|████▊ | 482/1000 [00:00<00:00, 4190.87 it/sec]
INFO - 16:14:08: 48%|████▊ | 483/1000 [00:00<00:00, 4190.48 it/sec]
INFO - 16:14:08: 48%|████▊ | 484/1000 [00:00<00:00, 4190.86 it/sec]
INFO - 16:14:08: 48%|████▊ | 485/1000 [00:00<00:00, 4191.31 it/sec]
INFO - 16:14:08: 49%|████▊ | 486/1000 [00:00<00:00, 4191.59 it/sec]
INFO - 16:14:08: 49%|████▊ | 487/1000 [00:00<00:00, 4191.03 it/sec]
INFO - 16:14:08: 49%|████▉ | 488/1000 [00:00<00:00, 4190.68 it/sec]
INFO - 16:14:08: 49%|████▉ | 489/1000 [00:00<00:00, 4191.05 it/sec]
INFO - 16:14:08: 49%|████▉ | 490/1000 [00:00<00:00, 4191.46 it/sec]
INFO - 16:14:08: 49%|████▉ | 491/1000 [00:00<00:00, 4191.73 it/sec]
INFO - 16:14:08: 49%|████▉ | 492/1000 [00:00<00:00, 4191.11 it/sec]
INFO - 16:14:08: 49%|████▉ | 493/1000 [00:00<00:00, 4191.25 it/sec]
INFO - 16:14:08: 49%|████▉ | 494/1000 [00:00<00:00, 4191.48 it/sec]
INFO - 16:14:08: 50%|████▉ | 495/1000 [00:00<00:00, 4191.94 it/sec]
INFO - 16:14:08: 50%|████▉ | 496/1000 [00:00<00:00, 4191.57 it/sec]
INFO - 16:14:08: 50%|████▉ | 497/1000 [00:00<00:00, 4191.93 it/sec]
INFO - 16:14:08: 50%|████▉ | 498/1000 [00:00<00:00, 4192.03 it/sec]
INFO - 16:14:08: 50%|████▉ | 499/1000 [00:00<00:00, 4192.25 it/sec]
INFO - 16:14:08: 50%|█████ | 500/1000 [00:00<00:00, 4191.91 it/sec]
INFO - 16:14:08: 50%|█████ | 501/1000 [00:00<00:00, 4192.12 it/sec]
INFO - 16:14:08: 50%|█████ | 502/1000 [00:00<00:00, 4192.33 it/sec]
INFO - 16:14:08: 50%|█████ | 503/1000 [00:00<00:00, 4192.59 it/sec]
INFO - 16:14:08: 50%|█████ | 504/1000 [00:00<00:00, 4192.38 it/sec]
INFO - 16:14:08: 50%|█████ | 505/1000 [00:00<00:00, 4192.49 it/sec]
INFO - 16:14:08: 51%|█████ | 506/1000 [00:00<00:00, 4192.62 it/sec]
INFO - 16:14:08: 51%|█████ | 507/1000 [00:00<00:00, 4193.02 it/sec]
INFO - 16:14:08: 51%|█████ | 508/1000 [00:00<00:00, 4193.50 it/sec]
INFO - 16:14:08: 51%|█████ | 509/1000 [00:00<00:00, 4192.94 it/sec]
INFO - 16:14:08: 51%|█████ | 510/1000 [00:00<00:00, 4193.17 it/sec]
INFO - 16:14:08: 51%|█████ | 511/1000 [00:00<00:00, 4193.66 it/sec]
INFO - 16:14:08: 51%|█████ | 512/1000 [00:00<00:00, 4194.08 it/sec]
INFO - 16:14:08: 51%|█████▏ | 513/1000 [00:00<00:00, 4193.67 it/sec]
INFO - 16:14:08: 51%|█████▏ | 514/1000 [00:00<00:00, 4193.77 it/sec]
INFO - 16:14:08: 52%|█████▏ | 515/1000 [00:00<00:00, 4193.97 it/sec]
INFO - 16:14:08: 52%|█████▏ | 516/1000 [00:00<00:00, 4194.38 it/sec]
INFO - 16:14:08: 52%|█████▏ | 517/1000 [00:00<00:00, 4194.15 it/sec]
INFO - 16:14:08: 52%|█████▏ | 518/1000 [00:00<00:00, 4194.29 it/sec]
INFO - 16:14:08: 52%|█████▏ | 519/1000 [00:00<00:00, 4194.55 it/sec]
INFO - 16:14:08: 52%|█████▏ | 520/1000 [00:00<00:00, 4195.06 it/sec]
INFO - 16:14:08: 52%|█████▏ | 521/1000 [00:00<00:00, 4195.02 it/sec]
INFO - 16:14:08: 52%|█████▏ | 522/1000 [00:00<00:00, 4195.02 it/sec]
INFO - 16:14:08: 52%|█████▏ | 523/1000 [00:00<00:00, 4195.36 it/sec]
INFO - 16:14:08: 52%|█████▏ | 524/1000 [00:00<00:00, 4195.81 it/sec]
INFO - 16:14:08: 52%|█████▎ | 525/1000 [00:00<00:00, 4196.29 it/sec]
INFO - 16:14:08: 53%|█████▎ | 526/1000 [00:00<00:00, 4195.85 it/sec]
INFO - 16:14:08: 53%|█████▎ | 527/1000 [00:00<00:00, 4196.02 it/sec]
INFO - 16:14:08: 53%|█████▎ | 528/1000 [00:00<00:00, 4196.39 it/sec]
INFO - 16:14:08: 53%|█████▎ | 529/1000 [00:00<00:00, 4196.84 it/sec]
INFO - 16:14:08: 53%|█████▎ | 530/1000 [00:00<00:00, 4196.55 it/sec]
INFO - 16:14:08: 53%|█████▎ | 531/1000 [00:00<00:00, 4196.75 it/sec]
INFO - 16:14:08: 53%|█████▎ | 532/1000 [00:00<00:00, 4197.01 it/sec]
INFO - 16:14:08: 53%|█████▎ | 533/1000 [00:00<00:00, 4197.45 it/sec]
INFO - 16:14:08: 53%|█████▎ | 534/1000 [00:00<00:00, 4197.06 it/sec]
INFO - 16:14:08: 54%|█████▎ | 535/1000 [00:00<00:00, 4197.25 it/sec]
INFO - 16:14:08: 54%|█████▎ | 536/1000 [00:00<00:00, 4197.39 it/sec]
INFO - 16:14:08: 54%|█████▎ | 537/1000 [00:00<00:00, 4197.42 it/sec]
INFO - 16:14:08: 54%|█████▍ | 538/1000 [00:00<00:00, 4197.06 it/sec]
INFO - 16:14:08: 54%|█████▍ | 539/1000 [00:00<00:00, 4197.01 it/sec]
INFO - 16:14:08: 54%|█████▍ | 540/1000 [00:00<00:00, 4197.23 it/sec]
INFO - 16:14:08: 54%|█████▍ | 541/1000 [00:00<00:00, 4197.51 it/sec]
INFO - 16:14:08: 54%|█████▍ | 542/1000 [00:00<00:00, 4197.80 it/sec]
INFO - 16:14:08: 54%|█████▍ | 543/1000 [00:00<00:00, 4197.14 it/sec]
INFO - 16:14:08: 54%|█████▍ | 544/1000 [00:00<00:00, 4197.40 it/sec]
INFO - 16:14:08: 55%|█████▍ | 545/1000 [00:00<00:00, 4197.85 it/sec]
INFO - 16:14:08: 55%|█████▍ | 546/1000 [00:00<00:00, 4198.12 it/sec]
INFO - 16:14:08: 55%|█████▍ | 547/1000 [00:00<00:00, 4197.86 it/sec]
INFO - 16:14:08: 55%|█████▍ | 548/1000 [00:00<00:00, 4198.12 it/sec]
INFO - 16:14:08: 55%|█████▍ | 549/1000 [00:00<00:00, 4198.20 it/sec]
INFO - 16:14:08: 55%|█████▌ | 550/1000 [00:00<00:00, 4198.62 it/sec]
INFO - 16:14:08: 55%|█████▌ | 551/1000 [00:00<00:00, 4198.41 it/sec]
INFO - 16:14:08: 55%|█████▌ | 552/1000 [00:00<00:00, 4198.71 it/sec]
INFO - 16:14:08: 55%|█████▌ | 553/1000 [00:00<00:00, 4199.17 it/sec]
INFO - 16:14:08: 55%|█████▌ | 554/1000 [00:00<00:00, 4199.46 it/sec]
INFO - 16:14:08: 56%|█████▌ | 555/1000 [00:00<00:00, 4199.94 it/sec]
INFO - 16:14:08: 56%|█████▌ | 556/1000 [00:00<00:00, 4199.36 it/sec]
INFO - 16:14:08: 56%|█████▌ | 557/1000 [00:00<00:00, 4199.35 it/sec]
INFO - 16:14:08: 56%|█████▌ | 558/1000 [00:00<00:00, 4199.57 it/sec]
INFO - 16:14:08: 56%|█████▌ | 559/1000 [00:00<00:00, 4199.89 it/sec]
INFO - 16:14:08: 56%|█████▌ | 560/1000 [00:00<00:00, 4199.45 it/sec]
INFO - 16:14:08: 56%|█████▌ | 561/1000 [00:00<00:00, 4199.72 it/sec]
INFO - 16:14:08: 56%|█████▌ | 562/1000 [00:00<00:00, 4200.15 it/sec]
INFO - 16:14:08: 56%|█████▋ | 563/1000 [00:00<00:00, 4200.52 it/sec]
INFO - 16:14:08: 56%|█████▋ | 564/1000 [00:00<00:00, 4200.28 it/sec]
INFO - 16:14:08: 56%|█████▋ | 565/1000 [00:00<00:00, 4200.53 it/sec]
INFO - 16:14:08: 57%|█████▋ | 566/1000 [00:00<00:00, 4200.17 it/sec]
INFO - 16:14:08: 57%|█████▋ | 567/1000 [00:00<00:00, 4200.42 it/sec]
INFO - 16:14:08: 57%|█████▋ | 568/1000 [00:00<00:00, 4200.10 it/sec]
INFO - 16:14:08: 57%|█████▋ | 569/1000 [00:00<00:00, 4200.28 it/sec]
INFO - 16:14:08: 57%|█████▋ | 570/1000 [00:00<00:00, 4200.63 it/sec]
INFO - 16:14:08: 57%|█████▋ | 571/1000 [00:00<00:00, 4201.00 it/sec]
INFO - 16:14:08: 57%|█████▋ | 572/1000 [00:00<00:00, 4201.24 it/sec]
INFO - 16:14:08: 57%|█████▋ | 573/1000 [00:00<00:00, 4200.52 it/sec]
INFO - 16:14:08: 57%|█████▋ | 574/1000 [00:00<00:00, 4200.49 it/sec]
INFO - 16:14:08: 57%|█████▊ | 575/1000 [00:00<00:00, 4200.74 it/sec]
INFO - 16:14:08: 58%|█████▊ | 576/1000 [00:00<00:00, 4201.01 it/sec]
INFO - 16:14:08: 58%|█████▊ | 577/1000 [00:00<00:00, 4200.38 it/sec]
INFO - 16:14:08: 58%|█████▊ | 578/1000 [00:00<00:00, 4200.42 it/sec]
INFO - 16:14:08: 58%|█████▊ | 579/1000 [00:00<00:00, 4200.57 it/sec]
INFO - 16:14:08: 58%|█████▊ | 580/1000 [00:00<00:00, 4200.76 it/sec]
INFO - 16:14:08: 58%|█████▊ | 581/1000 [00:00<00:00, 4200.29 it/sec]
INFO - 16:14:08: 58%|█████▊ | 582/1000 [00:00<00:00, 4200.44 it/sec]
INFO - 16:14:08: 58%|█████▊ | 583/1000 [00:00<00:00, 4200.42 it/sec]
INFO - 16:14:08: 58%|█████▊ | 584/1000 [00:00<00:00, 4200.72 it/sec]
INFO - 16:14:08: 58%|█████▊ | 585/1000 [00:00<00:00, 4196.41 it/sec]
INFO - 16:14:08: 59%|█████▊ | 586/1000 [00:00<00:00, 4196.14 it/sec]
INFO - 16:14:08: 59%|█████▊ | 587/1000 [00:00<00:00, 4196.35 it/sec]
INFO - 16:14:08: 59%|█████▉ | 588/1000 [00:00<00:00, 4196.57 it/sec]
INFO - 16:14:08: 59%|█████▉ | 589/1000 [00:00<00:00, 4195.98 it/sec]
INFO - 16:14:08: 59%|█████▉ | 590/1000 [00:00<00:00, 4196.32 it/sec]
INFO - 16:14:08: 59%|█████▉ | 591/1000 [00:00<00:00, 4196.70 it/sec]
INFO - 16:14:08: 59%|█████▉ | 592/1000 [00:00<00:00, 4197.07 it/sec]
INFO - 16:14:08: 59%|█████▉ | 593/1000 [00:00<00:00, 4196.86 it/sec]
INFO - 16:14:08: 59%|█████▉ | 594/1000 [00:00<00:00, 4197.12 it/sec]
INFO - 16:14:08: 60%|█████▉ | 595/1000 [00:00<00:00, 4197.43 it/sec]
INFO - 16:14:08: 60%|█████▉ | 596/1000 [00:00<00:00, 4197.80 it/sec]
INFO - 16:14:08: 60%|█████▉ | 597/1000 [00:00<00:00, 4197.64 it/sec]
INFO - 16:14:08: 60%|█████▉ | 598/1000 [00:00<00:00, 4197.70 it/sec]
INFO - 16:14:08: 60%|█████▉ | 599/1000 [00:00<00:00, 4197.76 it/sec]
INFO - 16:14:08: 60%|██████ | 600/1000 [00:00<00:00, 4198.03 it/sec]
INFO - 16:14:08: 60%|██████ | 601/1000 [00:00<00:00, 4198.33 it/sec]
INFO - 16:14:08: 60%|██████ | 602/1000 [00:00<00:00, 4197.81 it/sec]
INFO - 16:14:08: 60%|██████ | 603/1000 [00:00<00:00, 4197.83 it/sec]
INFO - 16:14:08: 60%|██████ | 604/1000 [00:00<00:00, 4198.04 it/sec]
INFO - 16:14:08: 60%|██████ | 605/1000 [00:00<00:00, 4198.41 it/sec]
INFO - 16:14:08: 61%|██████ | 606/1000 [00:00<00:00, 4197.97 it/sec]
INFO - 16:14:08: 61%|██████ | 607/1000 [00:00<00:00, 4198.18 it/sec]
INFO - 16:14:08: 61%|██████ | 608/1000 [00:00<00:00, 4198.42 it/sec]
INFO - 16:14:08: 61%|██████ | 609/1000 [00:00<00:00, 4198.56 it/sec]
INFO - 16:14:08: 61%|██████ | 610/1000 [00:00<00:00, 4198.28 it/sec]
INFO - 16:14:08: 61%|██████ | 611/1000 [00:00<00:00, 4198.36 it/sec]
INFO - 16:14:08: 61%|██████ | 612/1000 [00:00<00:00, 4198.37 it/sec]
INFO - 16:14:08: 61%|██████▏ | 613/1000 [00:00<00:00, 4198.60 it/sec]
INFO - 16:14:08: 61%|██████▏ | 614/1000 [00:00<00:00, 4198.19 it/sec]
INFO - 16:14:08: 62%|██████▏ | 615/1000 [00:00<00:00, 4198.37 it/sec]
INFO - 16:14:08: 62%|██████▏ | 616/1000 [00:00<00:00, 4198.40 it/sec]
INFO - 16:14:08: 62%|██████▏ | 617/1000 [00:00<00:00, 4198.55 it/sec]
INFO - 16:14:08: 62%|██████▏ | 618/1000 [00:00<00:00, 4198.17 it/sec]
INFO - 16:14:08: 62%|██████▏ | 619/1000 [00:00<00:00, 4198.29 it/sec]
INFO - 16:14:08: 62%|██████▏ | 620/1000 [00:00<00:00, 4198.57 it/sec]
INFO - 16:14:08: 62%|██████▏ | 621/1000 [00:00<00:00, 4198.83 it/sec]
INFO - 16:14:08: 62%|██████▏ | 622/1000 [00:00<00:00, 4199.15 it/sec]
INFO - 16:14:08: 62%|██████▏ | 623/1000 [00:00<00:00, 4198.74 it/sec]
INFO - 16:14:08: 62%|██████▏ | 624/1000 [00:00<00:00, 4198.97 it/sec]
INFO - 16:14:08: 62%|██████▎ | 625/1000 [00:00<00:00, 4199.16 it/sec]
INFO - 16:14:08: 63%|██████▎ | 626/1000 [00:00<00:00, 4199.40 it/sec]
INFO - 16:14:08: 63%|██████▎ | 627/1000 [00:00<00:00, 4198.98 it/sec]
INFO - 16:14:08: 63%|██████▎ | 628/1000 [00:00<00:00, 4199.20 it/sec]
INFO - 16:14:08: 63%|██████▎ | 629/1000 [00:00<00:00, 4199.48 it/sec]
INFO - 16:14:08: 63%|██████▎ | 630/1000 [00:00<00:00, 4199.72 it/sec]
INFO - 16:14:08: 63%|██████▎ | 631/1000 [00:00<00:00, 4199.48 it/sec]
INFO - 16:14:08: 63%|██████▎ | 632/1000 [00:00<00:00, 4199.49 it/sec]
INFO - 16:14:08: 63%|██████▎ | 633/1000 [00:00<00:00, 4199.49 it/sec]
INFO - 16:14:08: 63%|██████▎ | 634/1000 [00:00<00:00, 4199.48 it/sec]
INFO - 16:14:08: 64%|██████▎ | 635/1000 [00:00<00:00, 4199.23 it/sec]
INFO - 16:14:08: 64%|██████▎ | 636/1000 [00:00<00:00, 4199.39 it/sec]
INFO - 16:14:08: 64%|██████▎ | 637/1000 [00:00<00:00, 4199.56 it/sec]
INFO - 16:14:08: 64%|██████▍ | 638/1000 [00:00<00:00, 4199.89 it/sec]
INFO - 16:14:08: 64%|██████▍ | 639/1000 [00:00<00:00, 4200.27 it/sec]
INFO - 16:14:08: 64%|██████▍ | 640/1000 [00:00<00:00, 4199.88 it/sec]
INFO - 16:14:08: 64%|██████▍ | 641/1000 [00:00<00:00, 4199.95 it/sec]
INFO - 16:14:08: 64%|██████▍ | 642/1000 [00:00<00:00, 4200.09 it/sec]
INFO - 16:14:08: 64%|██████▍ | 643/1000 [00:00<00:00, 4200.44 it/sec]
INFO - 16:14:08: 64%|██████▍ | 644/1000 [00:00<00:00, 4200.28 it/sec]
INFO - 16:14:08: 64%|██████▍ | 645/1000 [00:00<00:00, 4200.54 it/sec]
INFO - 16:14:08: 65%|██████▍ | 646/1000 [00:00<00:00, 4200.70 it/sec]
INFO - 16:14:08: 65%|██████▍ | 647/1000 [00:00<00:00, 4201.07 it/sec]
INFO - 16:14:08: 65%|██████▍ | 648/1000 [00:00<00:00, 4200.94 it/sec]
INFO - 16:14:08: 65%|██████▍ | 649/1000 [00:00<00:00, 4201.14 it/sec]
INFO - 16:14:08: 65%|██████▌ | 650/1000 [00:00<00:00, 4201.18 it/sec]
INFO - 16:14:08: 65%|██████▌ | 651/1000 [00:00<00:00, 4201.45 it/sec]
INFO - 16:14:08: 65%|██████▌ | 652/1000 [00:00<00:00, 4201.28 it/sec]
INFO - 16:14:08: 65%|██████▌ | 653/1000 [00:00<00:00, 4201.36 it/sec]
INFO - 16:14:08: 65%|██████▌ | 654/1000 [00:00<00:00, 4201.67 it/sec]
INFO - 16:14:08: 66%|██████▌ | 655/1000 [00:00<00:00, 4202.05 it/sec]
INFO - 16:14:08: 66%|██████▌ | 656/1000 [00:00<00:00, 4202.33 it/sec]
INFO - 16:14:08: 66%|██████▌ | 657/1000 [00:00<00:00, 4201.95 it/sec]
INFO - 16:14:08: 66%|██████▌ | 658/1000 [00:00<00:00, 4202.22 it/sec]
INFO - 16:14:08: 66%|██████▌ | 659/1000 [00:00<00:00, 4202.54 it/sec]
INFO - 16:14:08: 66%|██████▌ | 660/1000 [00:00<00:00, 4202.80 it/sec]
INFO - 16:14:08: 66%|██████▌ | 661/1000 [00:00<00:00, 4202.54 it/sec]
INFO - 16:14:08: 66%|██████▌ | 662/1000 [00:00<00:00, 4202.73 it/sec]
INFO - 16:14:08: 66%|██████▋ | 663/1000 [00:00<00:00, 4202.89 it/sec]
INFO - 16:14:08: 66%|██████▋ | 664/1000 [00:00<00:00, 4203.21 it/sec]
INFO - 16:14:08: 66%|██████▋ | 665/1000 [00:00<00:00, 4203.04 it/sec]
INFO - 16:14:08: 67%|██████▋ | 666/1000 [00:00<00:00, 4203.09 it/sec]
INFO - 16:14:08: 67%|██████▋ | 667/1000 [00:00<00:00, 4203.08 it/sec]
INFO - 16:14:08: 67%|██████▋ | 668/1000 [00:00<00:00, 4203.31 it/sec]
INFO - 16:14:08: 67%|██████▋ | 669/1000 [00:00<00:00, 4203.59 it/sec]
INFO - 16:14:08: 67%|██████▋ | 670/1000 [00:00<00:00, 4203.17 it/sec]
INFO - 16:14:08: 67%|██████▋ | 671/1000 [00:00<00:00, 4203.36 it/sec]
INFO - 16:14:08: 67%|██████▋ | 672/1000 [00:00<00:00, 4203.52 it/sec]
INFO - 16:14:08: 67%|██████▋ | 673/1000 [00:00<00:00, 4203.77 it/sec]
INFO - 16:14:08: 67%|██████▋ | 674/1000 [00:00<00:00, 4203.42 it/sec]
INFO - 16:14:08: 68%|██████▊ | 675/1000 [00:00<00:00, 4203.63 it/sec]
INFO - 16:14:08: 68%|██████▊ | 676/1000 [00:00<00:00, 4203.91 it/sec]
INFO - 16:14:08: 68%|██████▊ | 677/1000 [00:00<00:00, 4204.15 it/sec]
INFO - 16:14:08: 68%|██████▊ | 678/1000 [00:00<00:00, 4203.88 it/sec]
INFO - 16:14:08: 68%|██████▊ | 679/1000 [00:00<00:00, 4204.05 it/sec]
INFO - 16:14:08: 68%|██████▊ | 680/1000 [00:00<00:00, 4204.28 it/sec]
INFO - 16:14:08: 68%|██████▊ | 681/1000 [00:00<00:00, 4204.59 it/sec]
INFO - 16:14:08: 68%|██████▊ | 682/1000 [00:00<00:00, 4204.48 it/sec]
INFO - 16:14:08: 68%|██████▊ | 683/1000 [00:00<00:00, 4204.33 it/sec]
INFO - 16:14:08: 68%|██████▊ | 684/1000 [00:00<00:00, 4204.37 it/sec]
INFO - 16:14:08: 68%|██████▊ | 685/1000 [00:00<00:00, 4204.63 it/sec]
INFO - 16:14:08: 69%|██████▊ | 686/1000 [00:00<00:00, 4204.88 it/sec]
INFO - 16:14:08: 69%|██████▊ | 687/1000 [00:00<00:00, 4204.54 it/sec]
INFO - 16:14:08: 69%|██████▉ | 688/1000 [00:00<00:00, 4204.89 it/sec]
INFO - 16:14:08: 69%|██████▉ | 689/1000 [00:00<00:00, 4205.16 it/sec]
INFO - 16:14:08: 69%|██████▉ | 690/1000 [00:00<00:00, 4205.45 it/sec]
INFO - 16:14:08: 69%|██████▉ | 691/1000 [00:00<00:00, 4205.19 it/sec]
INFO - 16:14:08: 69%|██████▉ | 692/1000 [00:00<00:00, 4205.25 it/sec]
INFO - 16:14:08: 69%|██████▉ | 693/1000 [00:00<00:00, 4205.46 it/sec]
INFO - 16:14:08: 69%|██████▉ | 694/1000 [00:00<00:00, 4205.78 it/sec]
INFO - 16:14:08: 70%|██████▉ | 695/1000 [00:00<00:00, 4205.57 it/sec]
INFO - 16:14:08: 70%|██████▉ | 696/1000 [00:00<00:00, 4205.66 it/sec]
INFO - 16:14:08: 70%|██████▉ | 697/1000 [00:00<00:00, 4205.91 it/sec]
INFO - 16:14:08: 70%|██████▉ | 698/1000 [00:00<00:00, 4206.05 it/sec]
INFO - 16:14:08: 70%|██████▉ | 699/1000 [00:00<00:00, 4202.64 it/sec]
INFO - 16:14:08: 70%|███████ | 700/1000 [00:00<00:00, 4202.55 it/sec]
INFO - 16:14:08: 70%|███████ | 701/1000 [00:00<00:00, 4202.43 it/sec]
INFO - 16:14:08: 70%|███████ | 702/1000 [00:00<00:00, 4202.63 it/sec]
INFO - 16:14:08: 70%|███████ | 703/1000 [00:00<00:00, 4202.33 it/sec]
INFO - 16:14:08: 70%|███████ | 704/1000 [00:00<00:00, 4202.47 it/sec]
INFO - 16:14:08: 70%|███████ | 705/1000 [00:00<00:00, 4202.74 it/sec]
INFO - 16:14:08: 71%|███████ | 706/1000 [00:00<00:00, 4203.00 it/sec]
INFO - 16:14:08: 71%|███████ | 707/1000 [00:00<00:00, 4202.45 it/sec]
INFO - 16:14:08: 71%|███████ | 708/1000 [00:00<00:00, 4202.48 it/sec]
INFO - 16:14:08: 71%|███████ | 709/1000 [00:00<00:00, 4202.73 it/sec]
INFO - 16:14:08: 71%|███████ | 710/1000 [00:00<00:00, 4202.98 it/sec]
INFO - 16:14:08: 71%|███████ | 711/1000 [00:00<00:00, 4203.11 it/sec]
INFO - 16:14:08: 71%|███████ | 712/1000 [00:00<00:00, 4202.44 it/sec]
INFO - 16:14:08: 71%|███████▏ | 713/1000 [00:00<00:00, 4202.36 it/sec]
INFO - 16:14:08: 71%|███████▏ | 714/1000 [00:00<00:00, 4202.50 it/sec]
INFO - 16:14:08: 72%|███████▏ | 715/1000 [00:00<00:00, 4202.67 it/sec]
INFO - 16:14:08: 72%|███████▏ | 716/1000 [00:00<00:00, 4202.06 it/sec]
INFO - 16:14:08: 72%|███████▏ | 717/1000 [00:00<00:00, 4202.16 it/sec]
INFO - 16:14:08: 72%|███████▏ | 718/1000 [00:00<00:00, 4202.21 it/sec]
INFO - 16:14:08: 72%|███████▏ | 719/1000 [00:00<00:00, 4202.34 it/sec]
INFO - 16:14:08: 72%|███████▏ | 720/1000 [00:00<00:00, 4201.77 it/sec]
INFO - 16:14:08: 72%|███████▏ | 721/1000 [00:00<00:00, 4201.92 it/sec]
INFO - 16:14:08: 72%|███████▏ | 722/1000 [00:00<00:00, 4202.21 it/sec]
INFO - 16:14:08: 72%|███████▏ | 723/1000 [00:00<00:00, 4202.28 it/sec]
INFO - 16:14:08: 72%|███████▏ | 724/1000 [00:00<00:00, 4201.97 it/sec]
INFO - 16:14:08: 72%|███████▎ | 725/1000 [00:00<00:00, 4202.02 it/sec]
INFO - 16:14:08: 73%|███████▎ | 726/1000 [00:00<00:00, 4201.90 it/sec]
INFO - 16:14:08: 73%|███████▎ | 727/1000 [00:00<00:00, 4202.21 it/sec]
INFO - 16:14:08: 73%|███████▎ | 728/1000 [00:00<00:00, 4201.98 it/sec]
INFO - 16:14:08: 73%|███████▎ | 729/1000 [00:00<00:00, 4201.96 it/sec]
INFO - 16:14:08: 73%|███████▎ | 730/1000 [00:00<00:00, 4202.11 it/sec]
INFO - 16:14:08: 73%|███████▎ | 731/1000 [00:00<00:00, 4202.36 it/sec]
INFO - 16:14:08: 73%|███████▎ | 732/1000 [00:00<00:00, 4202.20 it/sec]
INFO - 16:14:08: 73%|███████▎ | 733/1000 [00:00<00:00, 4202.21 it/sec]
INFO - 16:14:08: 73%|███████▎ | 734/1000 [00:00<00:00, 4202.24 it/sec]
INFO - 16:14:08: 74%|███████▎ | 735/1000 [00:00<00:00, 4202.39 it/sec]
INFO - 16:14:08: 74%|███████▎ | 736/1000 [00:00<00:00, 4202.53 it/sec]
INFO - 16:14:08: 74%|███████▎ | 737/1000 [00:00<00:00, 4202.20 it/sec]
INFO - 16:14:08: 74%|███████▍ | 738/1000 [00:00<00:00, 4202.41 it/sec]
INFO - 16:14:08: 74%|███████▍ | 739/1000 [00:00<00:00, 4202.59 it/sec]
INFO - 16:14:08: 74%|███████▍ | 740/1000 [00:00<00:00, 4202.74 it/sec]
INFO - 16:14:08: 74%|███████▍ | 741/1000 [00:00<00:00, 4202.29 it/sec]
INFO - 16:14:08: 74%|███████▍ | 742/1000 [00:00<00:00, 4202.37 it/sec]
INFO - 16:14:08: 74%|███████▍ | 743/1000 [00:00<00:00, 4202.45 it/sec]
INFO - 16:14:08: 74%|███████▍ | 744/1000 [00:00<00:00, 4202.60 it/sec]
INFO - 16:14:08: 74%|███████▍ | 745/1000 [00:00<00:00, 4202.29 it/sec]
INFO - 16:14:08: 75%|███████▍ | 746/1000 [00:00<00:00, 4202.33 it/sec]
INFO - 16:14:08: 75%|███████▍ | 747/1000 [00:00<00:00, 4202.44 it/sec]
INFO - 16:14:08: 75%|███████▍ | 748/1000 [00:00<00:00, 4202.63 it/sec]
INFO - 16:14:08: 75%|███████▍ | 749/1000 [00:00<00:00, 4202.33 it/sec]
INFO - 16:14:08: 75%|███████▌ | 750/1000 [00:00<00:00, 4202.38 it/sec]
INFO - 16:14:08: 75%|███████▌ | 751/1000 [00:00<00:00, 4202.19 it/sec]
INFO - 16:14:08: 75%|███████▌ | 752/1000 [00:00<00:00, 4202.32 it/sec]
INFO - 16:14:08: 75%|███████▌ | 753/1000 [00:00<00:00, 4202.15 it/sec]
INFO - 16:14:08: 75%|███████▌ | 754/1000 [00:00<00:00, 4202.15 it/sec]
INFO - 16:14:08: 76%|███████▌ | 755/1000 [00:00<00:00, 4202.36 it/sec]
INFO - 16:14:08: 76%|███████▌ | 756/1000 [00:00<00:00, 4202.52 it/sec]
INFO - 16:14:08: 76%|███████▌ | 757/1000 [00:00<00:00, 4202.79 it/sec]
INFO - 16:14:08: 76%|███████▌ | 758/1000 [00:00<00:00, 4202.30 it/sec]
INFO - 16:14:08: 76%|███████▌ | 759/1000 [00:00<00:00, 4202.39 it/sec]
INFO - 16:14:08: 76%|███████▌ | 760/1000 [00:00<00:00, 4202.48 it/sec]
INFO - 16:14:08: 76%|███████▌ | 761/1000 [00:00<00:00, 4202.70 it/sec]
INFO - 16:14:08: 76%|███████▌ | 762/1000 [00:00<00:00, 4202.26 it/sec]
INFO - 16:14:08: 76%|███████▋ | 763/1000 [00:00<00:00, 4202.37 it/sec]
INFO - 16:14:08: 76%|███████▋ | 764/1000 [00:00<00:00, 4202.53 it/sec]
INFO - 16:14:08: 76%|███████▋ | 765/1000 [00:00<00:00, 4202.82 it/sec]
INFO - 16:14:08: 77%|███████▋ | 766/1000 [00:00<00:00, 4202.64 it/sec]
INFO - 16:14:08: 77%|███████▋ | 767/1000 [00:00<00:00, 4202.79 it/sec]
INFO - 16:14:08: 77%|███████▋ | 768/1000 [00:00<00:00, 4202.83 it/sec]
INFO - 16:14:08: 77%|███████▋ | 769/1000 [00:00<00:00, 4203.03 it/sec]
INFO - 16:14:08: 77%|███████▋ | 770/1000 [00:00<00:00, 4202.93 it/sec]
INFO - 16:14:08: 77%|███████▋ | 771/1000 [00:00<00:00, 4203.08 it/sec]
INFO - 16:14:08: 77%|███████▋ | 772/1000 [00:00<00:00, 4203.38 it/sec]
INFO - 16:14:08: 77%|███████▋ | 773/1000 [00:00<00:00, 4203.56 it/sec]
INFO - 16:14:08: 77%|███████▋ | 774/1000 [00:00<00:00, 4203.76 it/sec]
INFO - 16:14:08: 78%|███████▊ | 775/1000 [00:00<00:00, 4203.44 it/sec]
INFO - 16:14:08: 78%|███████▊ | 776/1000 [00:00<00:00, 4203.69 it/sec]
INFO - 16:14:08: 78%|███████▊ | 777/1000 [00:00<00:00, 4203.99 it/sec]
INFO - 16:14:08: 78%|███████▊ | 778/1000 [00:00<00:00, 4204.21 it/sec]
INFO - 16:14:08: 78%|███████▊ | 779/1000 [00:00<00:00, 4204.05 it/sec]
INFO - 16:14:08: 78%|███████▊ | 780/1000 [00:00<00:00, 4204.15 it/sec]
INFO - 16:14:08: 78%|███████▊ | 781/1000 [00:00<00:00, 4204.34 it/sec]
INFO - 16:14:08: 78%|███████▊ | 782/1000 [00:00<00:00, 4204.40 it/sec]
INFO - 16:14:08: 78%|███████▊ | 783/1000 [00:00<00:00, 4204.13 it/sec]
INFO - 16:14:08: 78%|███████▊ | 784/1000 [00:00<00:00, 4204.26 it/sec]
INFO - 16:14:08: 78%|███████▊ | 785/1000 [00:00<00:00, 4204.26 it/sec]
INFO - 16:14:08: 79%|███████▊ | 786/1000 [00:00<00:00, 4204.20 it/sec]
INFO - 16:14:08: 79%|███████▊ | 787/1000 [00:00<00:00, 4203.99 it/sec]
INFO - 16:14:08: 79%|███████▉ | 788/1000 [00:00<00:00, 4204.06 it/sec]
INFO - 16:14:08: 79%|███████▉ | 789/1000 [00:00<00:00, 4204.35 it/sec]
INFO - 16:14:08: 79%|███████▉ | 790/1000 [00:00<00:00, 4204.61 it/sec]
INFO - 16:14:08: 79%|███████▉ | 791/1000 [00:00<00:00, 4204.77 it/sec]
INFO - 16:14:08: 79%|███████▉ | 792/1000 [00:00<00:00, 4204.41 it/sec]
INFO - 16:14:08: 79%|███████▉ | 793/1000 [00:00<00:00, 4204.59 it/sec]
INFO - 16:14:08: 79%|███████▉ | 794/1000 [00:00<00:00, 4204.69 it/sec]
INFO - 16:14:08: 80%|███████▉ | 795/1000 [00:00<00:00, 4204.93 it/sec]
INFO - 16:14:08: 80%|███████▉ | 796/1000 [00:00<00:00, 4204.66 it/sec]
INFO - 16:14:08: 80%|███████▉ | 797/1000 [00:00<00:00, 4204.78 it/sec]
INFO - 16:14:08: 80%|███████▉ | 798/1000 [00:00<00:00, 4204.99 it/sec]
INFO - 16:14:08: 80%|███████▉ | 799/1000 [00:00<00:00, 4205.24 it/sec]
INFO - 16:14:08: 80%|████████ | 800/1000 [00:00<00:00, 4205.01 it/sec]
INFO - 16:14:08: 80%|████████ | 801/1000 [00:00<00:00, 4205.11 it/sec]
INFO - 16:14:08: 80%|████████ | 802/1000 [00:00<00:00, 4205.09 it/sec]
INFO - 16:14:08: 80%|████████ | 803/1000 [00:00<00:00, 4205.19 it/sec]
INFO - 16:14:08: 80%|████████ | 804/1000 [00:00<00:00, 4205.10 it/sec]
INFO - 16:14:08: 80%|████████ | 805/1000 [00:00<00:00, 4205.12 it/sec]
INFO - 16:14:08: 81%|████████ | 806/1000 [00:00<00:00, 4205.31 it/sec]
INFO - 16:14:08: 81%|████████ | 807/1000 [00:00<00:00, 4205.58 it/sec]
INFO - 16:14:08: 81%|████████ | 808/1000 [00:00<00:00, 4205.72 it/sec]
INFO - 16:14:08: 81%|████████ | 809/1000 [00:00<00:00, 4205.28 it/sec]
INFO - 16:14:08: 81%|████████ | 810/1000 [00:00<00:00, 4205.42 it/sec]
INFO - 16:14:08: 81%|████████ | 811/1000 [00:00<00:00, 4205.61 it/sec]
INFO - 16:14:08: 81%|████████ | 812/1000 [00:00<00:00, 4205.79 it/sec]
INFO - 16:14:08: 81%|████████▏ | 813/1000 [00:00<00:00, 4203.04 it/sec]
INFO - 16:14:08: 81%|████████▏ | 814/1000 [00:00<00:00, 4202.98 it/sec]
INFO - 16:14:08: 82%|████████▏ | 815/1000 [00:00<00:00, 4203.14 it/sec]
INFO - 16:14:08: 82%|████████▏ | 816/1000 [00:00<00:00, 4203.20 it/sec]
INFO - 16:14:08: 82%|████████▏ | 817/1000 [00:00<00:00, 4202.62 it/sec]
INFO - 16:14:08: 82%|████████▏ | 818/1000 [00:00<00:00, 4202.61 it/sec]
INFO - 16:14:08: 82%|████████▏ | 819/1000 [00:00<00:00, 4202.69 it/sec]
INFO - 16:14:08: 82%|████████▏ | 820/1000 [00:00<00:00, 4202.89 it/sec]
INFO - 16:14:08: 82%|████████▏ | 821/1000 [00:00<00:00, 4202.58 it/sec]
INFO - 16:14:08: 82%|████████▏ | 822/1000 [00:00<00:00, 4202.72 it/sec]
INFO - 16:14:08: 82%|████████▏ | 823/1000 [00:00<00:00, 4202.88 it/sec]
INFO - 16:14:08: 82%|████████▏ | 824/1000 [00:00<00:00, 4203.04 it/sec]
INFO - 16:14:08: 82%|████████▎ | 825/1000 [00:00<00:00, 4202.84 it/sec]
INFO - 16:14:08: 83%|████████▎ | 826/1000 [00:00<00:00, 4202.85 it/sec]
INFO - 16:14:08: 83%|████████▎ | 827/1000 [00:00<00:00, 4203.08 it/sec]
INFO - 16:14:08: 83%|████████▎ | 828/1000 [00:00<00:00, 4203.31 it/sec]
INFO - 16:14:08: 83%|████████▎ | 829/1000 [00:00<00:00, 4203.08 it/sec]
INFO - 16:14:08: 83%|████████▎ | 830/1000 [00:00<00:00, 4203.26 it/sec]
INFO - 16:14:08: 83%|████████▎ | 831/1000 [00:00<00:00, 4203.52 it/sec]
INFO - 16:14:08: 83%|████████▎ | 832/1000 [00:00<00:00, 4203.63 it/sec]
INFO - 16:14:08: 83%|████████▎ | 833/1000 [00:00<00:00, 4203.79 it/sec]
INFO - 16:14:08: 83%|████████▎ | 834/1000 [00:00<00:00, 4203.26 it/sec]
INFO - 16:14:08: 84%|████████▎ | 835/1000 [00:00<00:00, 4203.25 it/sec]
INFO - 16:14:08: 84%|████████▎ | 836/1000 [00:00<00:00, 4203.36 it/sec]
INFO - 16:14:08: 84%|████████▎ | 837/1000 [00:00<00:00, 4203.47 it/sec]
INFO - 16:14:08: 84%|████████▍ | 838/1000 [00:00<00:00, 4203.12 it/sec]
INFO - 16:14:08: 84%|████████▍ | 839/1000 [00:00<00:00, 4203.20 it/sec]
INFO - 16:14:08: 84%|████████▍ | 840/1000 [00:00<00:00, 4203.34 it/sec]
INFO - 16:14:08: 84%|████████▍ | 841/1000 [00:00<00:00, 4203.58 it/sec]
INFO - 16:14:08: 84%|████████▍ | 842/1000 [00:00<00:00, 4203.34 it/sec]
INFO - 16:14:08: 84%|████████▍ | 843/1000 [00:00<00:00, 4203.49 it/sec]
INFO - 16:14:08: 84%|████████▍ | 844/1000 [00:00<00:00, 4203.71 it/sec]
INFO - 16:14:08: 84%|████████▍ | 845/1000 [00:00<00:00, 4203.98 it/sec]
INFO - 16:14:08: 85%|████████▍ | 846/1000 [00:00<00:00, 4203.81 it/sec]
INFO - 16:14:08: 85%|████████▍ | 847/1000 [00:00<00:00, 4203.99 it/sec]
INFO - 16:14:08: 85%|████████▍ | 848/1000 [00:00<00:00, 4204.15 it/sec]
INFO - 16:14:08: 85%|████████▍ | 849/1000 [00:00<00:00, 4204.41 it/sec]
INFO - 16:14:08: 85%|████████▌ | 850/1000 [00:00<00:00, 4204.71 it/sec]
INFO - 16:14:08: 85%|████████▌ | 851/1000 [00:00<00:00, 4204.27 it/sec]
INFO - 16:14:08: 85%|████████▌ | 852/1000 [00:00<00:00, 4204.31 it/sec]
INFO - 16:14:08: 85%|████████▌ | 853/1000 [00:00<00:00, 4204.51 it/sec]
INFO - 16:14:08: 85%|████████▌ | 854/1000 [00:00<00:00, 4204.84 it/sec]
INFO - 16:14:08: 86%|████████▌ | 855/1000 [00:00<00:00, 4204.61 it/sec]
INFO - 16:14:08: 86%|████████▌ | 856/1000 [00:00<00:00, 4204.66 it/sec]
INFO - 16:14:08: 86%|████████▌ | 857/1000 [00:00<00:00, 4204.91 it/sec]
INFO - 16:14:08: 86%|████████▌ | 858/1000 [00:00<00:00, 4205.18 it/sec]
INFO - 16:14:08: 86%|████████▌ | 859/1000 [00:00<00:00, 4205.00 it/sec]
INFO - 16:14:08: 86%|████████▌ | 860/1000 [00:00<00:00, 4205.17 it/sec]
INFO - 16:14:08: 86%|████████▌ | 861/1000 [00:00<00:00, 4205.44 it/sec]
INFO - 16:14:08: 86%|████████▌ | 862/1000 [00:00<00:00, 4205.67 it/sec]
INFO - 16:14:08: 86%|████████▋ | 863/1000 [00:00<00:00, 4205.55 it/sec]
INFO - 16:14:08: 86%|████████▋ | 864/1000 [00:00<00:00, 4205.55 it/sec]
INFO - 16:14:08: 86%|████████▋ | 865/1000 [00:00<00:00, 4205.77 it/sec]
INFO - 16:14:08: 87%|████████▋ | 866/1000 [00:00<00:00, 4205.92 it/sec]
INFO - 16:14:08: 87%|████████▋ | 867/1000 [00:00<00:00, 4206.05 it/sec]
INFO - 16:14:08: 87%|████████▋ | 868/1000 [00:00<00:00, 4205.68 it/sec]
INFO - 16:14:08: 87%|████████▋ | 869/1000 [00:00<00:00, 4205.83 it/sec]
INFO - 16:14:08: 87%|████████▋ | 870/1000 [00:00<00:00, 4205.72 it/sec]
INFO - 16:14:08: 87%|████████▋ | 871/1000 [00:00<00:00, 4205.86 it/sec]
INFO - 16:14:08: 87%|████████▋ | 872/1000 [00:00<00:00, 4205.53 it/sec]
INFO - 16:14:08: 87%|████████▋ | 873/1000 [00:00<00:00, 4205.61 it/sec]
INFO - 16:14:08: 87%|████████▋ | 874/1000 [00:00<00:00, 4205.81 it/sec]
INFO - 16:14:08: 88%|████████▊ | 875/1000 [00:00<00:00, 4206.06 it/sec]
INFO - 16:14:08: 88%|████████▊ | 876/1000 [00:00<00:00, 4205.81 it/sec]
INFO - 16:14:08: 88%|████████▊ | 877/1000 [00:00<00:00, 4205.93 it/sec]
INFO - 16:14:08: 88%|████████▊ | 878/1000 [00:00<00:00, 4206.15 it/sec]
INFO - 16:14:08: 88%|████████▊ | 879/1000 [00:00<00:00, 4206.31 it/sec]
INFO - 16:14:08: 88%|████████▊ | 880/1000 [00:00<00:00, 4206.20 it/sec]
INFO - 16:14:08: 88%|████████▊ | 881/1000 [00:00<00:00, 4206.33 it/sec]
INFO - 16:14:08: 88%|████████▊ | 882/1000 [00:00<00:00, 4206.52 it/sec]
INFO - 16:14:08: 88%|████████▊ | 883/1000 [00:00<00:00, 4206.47 it/sec]
INFO - 16:14:08: 88%|████████▊ | 884/1000 [00:00<00:00, 4206.69 it/sec]
INFO - 16:14:08: 88%|████████▊ | 885/1000 [00:00<00:00, 4206.38 it/sec]
INFO - 16:14:08: 89%|████████▊ | 886/1000 [00:00<00:00, 4206.56 it/sec]
INFO - 16:14:08: 89%|████████▊ | 887/1000 [00:00<00:00, 4206.63 it/sec]
INFO - 16:14:08: 89%|████████▉ | 888/1000 [00:00<00:00, 4206.81 it/sec]
INFO - 16:14:08: 89%|████████▉ | 889/1000 [00:00<00:00, 4206.58 it/sec]
INFO - 16:14:08: 89%|████████▉ | 890/1000 [00:00<00:00, 4206.74 it/sec]
INFO - 16:14:08: 89%|████████▉ | 891/1000 [00:00<00:00, 4206.94 it/sec]
INFO - 16:14:08: 89%|████████▉ | 892/1000 [00:00<00:00, 4207.16 it/sec]
INFO - 16:14:08: 89%|████████▉ | 893/1000 [00:00<00:00, 4206.99 it/sec]
INFO - 16:14:08: 89%|████████▉ | 894/1000 [00:00<00:00, 4207.12 it/sec]
INFO - 16:14:08: 90%|████████▉ | 895/1000 [00:00<00:00, 4207.31 it/sec]
INFO - 16:14:08: 90%|████████▉ | 896/1000 [00:00<00:00, 4207.50 it/sec]
INFO - 16:14:08: 90%|████████▉ | 897/1000 [00:00<00:00, 4207.40 it/sec]
INFO - 16:14:08: 90%|████████▉ | 898/1000 [00:00<00:00, 4207.42 it/sec]
INFO - 16:14:08: 90%|████████▉ | 899/1000 [00:00<00:00, 4207.61 it/sec]
INFO - 16:14:08: 90%|█████████ | 900/1000 [00:00<00:00, 4207.79 it/sec]
INFO - 16:14:08: 90%|█████████ | 901/1000 [00:00<00:00, 4207.96 it/sec]
INFO - 16:14:08: 90%|█████████ | 902/1000 [00:00<00:00, 4207.60 it/sec]
INFO - 16:14:08: 90%|█████████ | 903/1000 [00:00<00:00, 4207.78 it/sec]
INFO - 16:14:08: 90%|█████████ | 904/1000 [00:00<00:00, 4207.74 it/sec]
INFO - 16:14:08: 90%|█████████ | 905/1000 [00:00<00:00, 4207.94 it/sec]
INFO - 16:14:08: 91%|█████████ | 906/1000 [00:00<00:00, 4207.68 it/sec]
INFO - 16:14:08: 91%|█████████ | 907/1000 [00:00<00:00, 4207.80 it/sec]
INFO - 16:14:08: 91%|█████████ | 908/1000 [00:00<00:00, 4208.00 it/sec]
INFO - 16:14:08: 91%|█████████ | 909/1000 [00:00<00:00, 4208.18 it/sec]
INFO - 16:14:08: 91%|█████████ | 910/1000 [00:00<00:00, 4207.98 it/sec]
INFO - 16:14:08: 91%|█████████ | 911/1000 [00:00<00:00, 4208.10 it/sec]
INFO - 16:14:08: 91%|█████████ | 912/1000 [00:00<00:00, 4208.32 it/sec]
INFO - 16:14:08: 91%|█████████▏| 913/1000 [00:00<00:00, 4208.50 it/sec]
INFO - 16:14:08: 91%|█████████▏| 914/1000 [00:00<00:00, 4208.31 it/sec]
INFO - 16:14:08: 92%|█████████▏| 915/1000 [00:00<00:00, 4208.27 it/sec]
INFO - 16:14:08: 92%|█████████▏| 916/1000 [00:00<00:00, 4208.44 it/sec]
INFO - 16:14:08: 92%|█████████▏| 917/1000 [00:00<00:00, 4208.64 it/sec]
INFO - 16:14:08: 92%|█████████▏| 918/1000 [00:00<00:00, 4208.83 it/sec]
INFO - 16:14:08: 92%|█████████▏| 919/1000 [00:00<00:00, 4208.50 it/sec]
INFO - 16:14:08: 92%|█████████▏| 920/1000 [00:00<00:00, 4208.63 it/sec]
INFO - 16:14:08: 92%|█████████▏| 921/1000 [00:00<00:00, 4208.57 it/sec]
INFO - 16:14:08: 92%|█████████▏| 922/1000 [00:00<00:00, 4208.66 it/sec]
INFO - 16:14:08: 92%|█████████▏| 923/1000 [00:00<00:00, 4208.38 it/sec]
INFO - 16:14:08: 92%|█████████▏| 924/1000 [00:00<00:00, 4208.42 it/sec]
INFO - 16:14:08: 92%|█████████▎| 925/1000 [00:00<00:00, 4208.12 it/sec]
INFO - 16:14:08: 93%|█████████▎| 926/1000 [00:00<00:00, 4208.15 it/sec]
INFO - 16:14:08: 93%|█████████▎| 927/1000 [00:00<00:00, 4205.56 it/sec]
INFO - 16:14:08: 93%|█████████▎| 928/1000 [00:00<00:00, 4205.38 it/sec]
INFO - 16:14:08: 93%|█████████▎| 929/1000 [00:00<00:00, 4205.41 it/sec]
INFO - 16:14:08: 93%|█████████▎| 930/1000 [00:00<00:00, 4205.46 it/sec]
INFO - 16:14:08: 93%|█████████▎| 931/1000 [00:00<00:00, 4205.11 it/sec]
INFO - 16:14:08: 93%|█████████▎| 932/1000 [00:00<00:00, 4205.24 it/sec]
INFO - 16:14:08: 93%|█████████▎| 933/1000 [00:00<00:00, 4205.41 it/sec]
INFO - 16:14:08: 93%|█████████▎| 934/1000 [00:00<00:00, 4205.52 it/sec]
INFO - 16:14:08: 94%|█████████▎| 935/1000 [00:00<00:00, 4205.17 it/sec]
INFO - 16:14:08: 94%|█████████▎| 936/1000 [00:00<00:00, 4205.26 it/sec]
INFO - 16:14:08: 94%|█████████▎| 937/1000 [00:00<00:00, 4205.28 it/sec]
INFO - 16:14:08: 94%|█████████▍| 938/1000 [00:00<00:00, 4205.45 it/sec]
INFO - 16:14:08: 94%|█████████▍| 939/1000 [00:00<00:00, 4205.27 it/sec]
INFO - 16:14:08: 94%|█████████▍| 940/1000 [00:00<00:00, 4205.36 it/sec]
INFO - 16:14:08: 94%|█████████▍| 941/1000 [00:00<00:00, 4205.55 it/sec]
INFO - 16:14:08: 94%|█████████▍| 942/1000 [00:00<00:00, 4205.70 it/sec]
INFO - 16:14:08: 94%|█████████▍| 943/1000 [00:00<00:00, 4205.41 it/sec]
INFO - 16:14:08: 94%|█████████▍| 944/1000 [00:00<00:00, 4205.50 it/sec]
INFO - 16:14:08: 94%|█████████▍| 945/1000 [00:00<00:00, 4205.70 it/sec]
INFO - 16:14:08: 95%|█████████▍| 946/1000 [00:00<00:00, 4205.84 it/sec]
INFO - 16:14:08: 95%|█████████▍| 947/1000 [00:00<00:00, 4205.97 it/sec]
INFO - 16:14:08: 95%|█████████▍| 948/1000 [00:00<00:00, 4205.67 it/sec]
INFO - 16:14:08: 95%|█████████▍| 949/1000 [00:00<00:00, 4205.80 it/sec]
INFO - 16:14:08: 95%|█████████▌| 950/1000 [00:00<00:00, 4206.00 it/sec]
INFO - 16:14:08: 95%|█████████▌| 951/1000 [00:00<00:00, 4206.15 it/sec]
INFO - 16:14:08: 95%|█████████▌| 952/1000 [00:00<00:00, 4205.78 it/sec]
INFO - 16:14:08: 95%|█████████▌| 953/1000 [00:00<00:00, 4205.78 it/sec]
INFO - 16:14:08: 95%|█████████▌| 954/1000 [00:00<00:00, 4205.71 it/sec]
INFO - 16:14:08: 96%|█████████▌| 955/1000 [00:00<00:00, 4205.80 it/sec]
INFO - 16:14:08: 96%|█████████▌| 956/1000 [00:00<00:00, 4205.53 it/sec]
INFO - 16:14:08: 96%|█████████▌| 957/1000 [00:00<00:00, 4205.57 it/sec]
INFO - 16:14:08: 96%|█████████▌| 958/1000 [00:00<00:00, 4205.67 it/sec]
INFO - 16:14:08: 96%|█████████▌| 959/1000 [00:00<00:00, 4205.76 it/sec]
INFO - 16:14:08: 96%|█████████▌| 960/1000 [00:00<00:00, 4205.51 it/sec]
INFO - 16:14:08: 96%|█████████▌| 961/1000 [00:00<00:00, 4205.64 it/sec]
INFO - 16:14:08: 96%|█████████▌| 962/1000 [00:00<00:00, 4205.80 it/sec]
INFO - 16:14:08: 96%|█████████▋| 963/1000 [00:00<00:00, 4205.96 it/sec]
INFO - 16:14:08: 96%|█████████▋| 964/1000 [00:00<00:00, 4205.84 it/sec]
INFO - 16:14:08: 96%|█████████▋| 965/1000 [00:00<00:00, 4205.91 it/sec]
INFO - 16:14:08: 97%|█████████▋| 966/1000 [00:00<00:00, 4205.97 it/sec]
INFO - 16:14:08: 97%|█████████▋| 967/1000 [00:00<00:00, 4206.20 it/sec]
INFO - 16:14:08: 97%|█████████▋| 968/1000 [00:00<00:00, 4206.40 it/sec]
INFO - 16:14:08: 97%|█████████▋| 969/1000 [00:00<00:00, 4206.05 it/sec]
INFO - 16:14:08: 97%|█████████▋| 970/1000 [00:00<00:00, 4206.11 it/sec]
INFO - 16:14:08: 97%|█████████▋| 971/1000 [00:00<00:00, 4206.00 it/sec]
INFO - 16:14:08: 97%|█████████▋| 972/1000 [00:00<00:00, 4206.07 it/sec]
INFO - 16:14:08: 97%|█████████▋| 973/1000 [00:00<00:00, 4205.79 it/sec]
INFO - 16:14:08: 97%|█████████▋| 974/1000 [00:00<00:00, 4205.90 it/sec]
INFO - 16:14:08: 98%|█████████▊| 975/1000 [00:00<00:00, 4206.07 it/sec]
INFO - 16:14:08: 98%|█████████▊| 976/1000 [00:00<00:00, 4206.16 it/sec]
INFO - 16:14:08: 98%|█████████▊| 977/1000 [00:00<00:00, 4205.96 it/sec]
INFO - 16:14:08: 98%|█████████▊| 978/1000 [00:00<00:00, 4205.95 it/sec]
INFO - 16:14:08: 98%|█████████▊| 979/1000 [00:00<00:00, 4206.10 it/sec]
INFO - 16:14:08: 98%|█████████▊| 980/1000 [00:00<00:00, 4206.29 it/sec]
INFO - 16:14:08: 98%|█████████▊| 981/1000 [00:00<00:00, 4206.08 it/sec]
INFO - 16:14:08: 98%|█████████▊| 982/1000 [00:00<00:00, 4206.16 it/sec]
INFO - 16:14:08: 98%|█████████▊| 983/1000 [00:00<00:00, 4206.32 it/sec]
INFO - 16:14:08: 98%|█████████▊| 984/1000 [00:00<00:00, 4206.46 it/sec]
INFO - 16:14:08: 98%|█████████▊| 985/1000 [00:00<00:00, 4206.62 it/sec]
INFO - 16:14:08: 99%|█████████▊| 986/1000 [00:00<00:00, 4206.30 it/sec]
INFO - 16:14:08: 99%|█████████▊| 987/1000 [00:00<00:00, 4206.30 it/sec]
INFO - 16:14:08: 99%|█████████▉| 988/1000 [00:00<00:00, 4206.28 it/sec]
INFO - 16:14:08: 99%|█████████▉| 989/1000 [00:00<00:00, 4206.43 it/sec]
INFO - 16:14:08: 99%|█████████▉| 990/1000 [00:00<00:00, 4206.13 it/sec]
INFO - 16:14:08: 99%|█████████▉| 991/1000 [00:00<00:00, 4206.21 it/sec]
INFO - 16:14:08: 99%|█████████▉| 992/1000 [00:00<00:00, 4206.40 it/sec]
INFO - 16:14:08: 99%|█████████▉| 993/1000 [00:00<00:00, 4206.58 it/sec]
INFO - 16:14:08: 99%|█████████▉| 994/1000 [00:00<00:00, 4206.31 it/sec]
INFO - 16:14:08: 100%|█████████▉| 995/1000 [00:00<00:00, 4206.32 it/sec]
INFO - 16:14:08: 100%|█████████▉| 996/1000 [00:00<00:00, 4206.30 it/sec]
INFO - 16:14:08: 100%|█████████▉| 997/1000 [00:00<00:00, 4206.40 it/sec]
INFO - 16:14:08: 100%|█████████▉| 998/1000 [00:00<00:00, 4206.15 it/sec]
INFO - 16:14:08: 100%|█████████▉| 999/1000 [00:00<00:00, 4206.19 it/sec]
INFO - 16:14:08: 100%|██████████| 1000/1000 [00:00<00:00, 4172.21 it/sec]
INFO - 16:14:08: *** End CorrelationAnalysisSamplingPhase execution ***
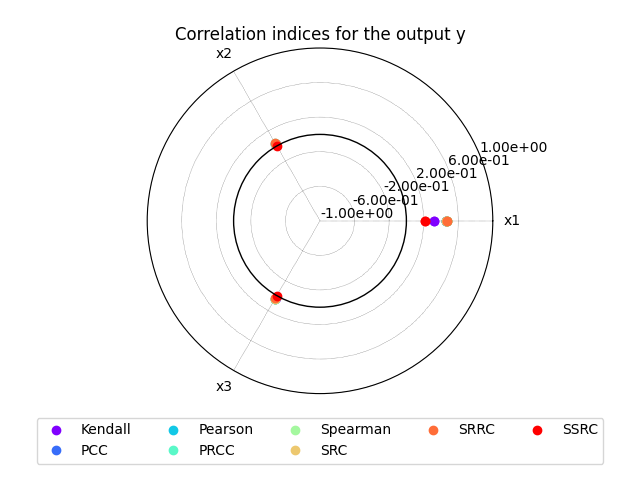
CorrelationAnalysis.SensitivityIndices(kendall={'y': [{'x1': array([0.31460661]), 'x2': array([0.02366366]), 'x3': array([0.0297978])}]}, pcc={'y': [{'x1': array([0.46282123]), 'x2': array([0.0306214]), 'x3': array([0.0512473])}]}, pearson={'y': [{'x1': array([0.46230446]), 'x2': array([0.02059071]), 'x3': array([0.04979026])}]}, prcc={'y': [{'x1': array([0.47248718]), 'x2': array([0.04368652]), 'x3': array([0.0419606])}]}, spearman={'y': [{'x1': array([0.47177886]), 'x2': array([0.03220921]), 'x3': array([0.04128518])}]}, src={'y': [{'x1': array([0.46220697]), 'x2': array([0.027121]), 'x3': array([0.04542585])}]}, srrc={'y': [{'x1': array([0.4718925]), 'x2': array([0.03849088]), 'x3': array([0.03696642])}]}, ssrc={'y': [{'x1': array([0.21363529]), 'x2': array([0.00073555]), 'x3': array([0.00206351])}]})
The resulting indices are
the Pearson correlation coefficients,
the Spearman correlation coefficients,
the Partial Correlation Coefficients (PCC),
the Partial Rank Correlation Coefficients (PRCC),
the Standard Regression Coefficients (SRC),
the Standard Rank Regression Coefficient (SRRC),
the Signed Standard Rank Regression Coefficient (SSRRC):
sensitivity_analysis.indices
CorrelationAnalysis.SensitivityIndices(kendall={'y': [{'x1': array([0.31460661]), 'x2': array([0.02366366]), 'x3': array([0.0297978])}]}, pcc={'y': [{'x1': array([0.46282123]), 'x2': array([0.0306214]), 'x3': array([0.0512473])}]}, pearson={'y': [{'x1': array([0.46230446]), 'x2': array([0.02059071]), 'x3': array([0.04979026])}]}, prcc={'y': [{'x1': array([0.47248718]), 'x2': array([0.04368652]), 'x3': array([0.0419606])}]}, spearman={'y': [{'x1': array([0.47177886]), 'x2': array([0.03220921]), 'x3': array([0.04128518])}]}, src={'y': [{'x1': array([0.46220697]), 'x2': array([0.027121]), 'x3': array([0.04542585])}]}, srrc={'y': [{'x1': array([0.4718925]), 'x2': array([0.03849088]), 'x3': array([0.03696642])}]}, ssrc={'y': [{'x1': array([0.21363529]), 'x2': array([0.00073555]), 'x3': array([0.00206351])}]})
The main indices corresponds to the Spearman correlation indices
(this main method can be changed with CorrelationAnalysis.main_method):
pprint.pprint(sensitivity_analysis.main_indices)
{'y': [{'x1': array([0.47177886]),
        'x2': array([0.03220921]),
        'x3': array([0.04128518])}]}
We can also get the input parameters sorted by decreasing order of influence:
sensitivity_analysis.sort_input_variables("y")
['x1', 'x3', 'x2']
We can use the method CorrelationAnalysis.plot()
to visualize the different correlation coefficients:
sensitivity_analysis.plot("y", save=False, show=True)
<gemseo.post.dataset.radar_chart.RadarChart object at 0x7c4bbccdde20>
Lastly,
the sensitivity indices can be exported to a Dataset:
sensitivity_analysis.to_dataset()
Total running time of the script: (0 minutes 0.735 seconds)