andrews_curves module
Draw Andrews curves from a Dataset.
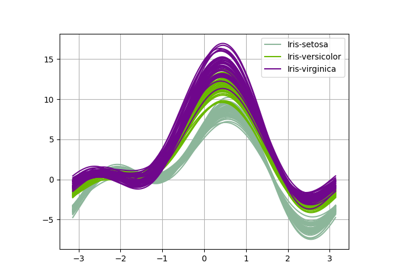
The AndrewsCurves class implements the Andrew plot, a.k.a. Andrews curves,
which is a way to visualize \(n\) samples of a high-dimensional vector
in a 2D referential by projecting each sample
onto the vector
which is composed of the \(d\) first elements of the Fourier series:
Each curve \(t\mapsto f_i(t)\) is plotted over the interval \([-\pi,\pi]\) and structure in the data may be visible in these \(n\) Andrews curves.
A variable name can be passed to the DatasetPlot.execute() method
by means of the classifier keyword
in order to color the curves according to the value of the variable name.
This is useful when the data is labeled.
- class gemseo.post.dataset.andrews_curves.AndrewsCurves(dataset, classifier)[source]
Bases:
DatasetPlotAndrews curves.
- Parameters:
- Raises:
ValueError – If the dataset is empty.
- execute(save=True, show=False, file_path=None, directory_path=None, file_name=None, file_format=None, properties=None, fig=None, axes=None, **plot_options)
Execute the post processing.
- Parameters:
save (bool) –
If True, save the plot.
By default it is set to True.
show (bool) –
If True, display the plot.
By default it is set to False.
file_path (str | Path | None) – The path of the file to save the figures. If None, create a file path from
directory_path,file_nameandfile_format.directory_path (str | Path | None) – The path of the directory to save the figures. If None, use the current working directory.
file_name (str | None) – The name of the file to save the figures. If None, use a default one generated by the post-processing.
file_format (str | None) – A file format, e.g. ‘png’, ‘pdf’, ‘svg’, … If None, use a default file extension.
properties (Mapping[str, DatasetPlotPropertyType] | None) – The general properties of a
DatasetPlot.fig (None | Figure) – The figure to plot the data. If
None, create a new one.axes (None | Axes) – The axes to plot the data. If
None, create new ones.**plot_options – The options of the current class inheriting from
DatasetPlot.
- Returns:
The figures.
- Raises:
AttributeError – When the name of a property is not the name of an attribute.
- Return type:
list[Figure]