gemseo / post / dataset

dataset_plot module

An abstract class to plot data from a Dataset.

The dataset_plot module implements the abstract DatasetPlot class whose purpose is to build a graphical representation of a Dataset and to display it on screen or save it to a file.

This abstract class has to be overloaded by concrete ones implementing at least method DatasetPlot._run().

class gemseo.post.dataset.dataset_plot.DatasetPlot(dataset, **kwargs)[source]

Bases: object

Abstract class for plotting a dataset.

Parameters:
  • dataset (Dataset) – The dataset containing the data to plot.

  • kwargs (Any) –

Raises:

ValueError – If the dataset is empty.

execute(save=True, show=False, file_path=None, directory_path=None, file_name=None, file_format=None, properties=None, fig=None, axes=None, **plot_options)[source]

Execute the post-processing.

Parameters:
  • save (bool) –

    If True, save the plot.

    By default it is set to True.

  • show (bool) –

    If True, display the plot.

    By default it is set to False.

  • file_path (str | Path | None) – The path of the file to save the figures. If None, create a file path from directory_path, file_name and file_format.

  • directory_path (str | Path | None) – The path of the directory to save the figures. If None, use the current working directory.

  • file_name (str | None) – The name of the file to save the figures. If None, use a default one generated by the post-processing.

  • file_format (str | None) – A file format, e.g. ‘png’, ‘pdf’, ‘svg’, … If None, use a default file extension.

  • properties (Mapping[str, DatasetPlotPropertyType] | None) – The general properties of a DatasetPlot.

  • fig (None | Figure) – The figure to plot the data. If None, create a new one.

  • axes (None | Axes) – The axes to plot the data. If None, create new ones.

  • **plot_options – The options of the current class inheriting from DatasetPlot.

Returns:

The figures.

Raises:

AttributeError – When the name of a property is not the name of an attribute.

Return type:

list[Figure]
color: str | list[str]

The color(s) for the series.

If empty, use a default one.

colormap: str

The color map.

dataset: Dataset

The dataset to be plotted.

fig_size: tuple[float, float]

The figure size.

property fig_size_x: float

The x-component of figure size.

property fig_size_y: float

The y-component of figure size.

font_size: int

The font size.

property labels: Mapping[str, str]

The labels of the variables.

legend_location: str

The location of the legend.

linestyle: str | list[str]

The line style(s) for the series.

If empty, use a default one.

marker: str | list[str]

The marker(s) for the series.

If empty, use a default one.

property output_files: list[str]

The paths to the output files.

title: str

The title of the plot.

xlabel: str

The label for the x-axis.

xmax: float | None

The maximum value on the x-axis.”.

If None, compute it from data.

xmin: float | None

The minimum value on the x-axis.

If None, compute it from data.

ylabel: str

The label for the y-axis.

ymax: float | None

The maximum value on the y-axis.

If None, compute it from data.

ymin: float | None

The minimum value on the y-axis.

If None, compute it from data.

zlabel: str

The label for the z-axis.

zmax: float | None

The maximum value on the z-axis.

If None, compute it from data.

zmin: float | None

The minimum value on the z-axis.

If None, compute it from data.

Examples using DatasetPlot

Burgers dataset

Burgers dataset

Burgers dataset
Iris dataset

Iris dataset

Iris dataset
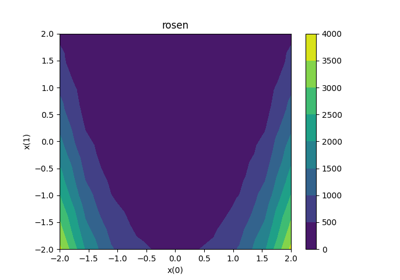
Rosenbrock dataset

Rosenbrock dataset

Rosenbrock dataset
Andrews curves

Andrews curves

Andrews curves
Bars

Bars

Bars
Boxplot

Boxplot

Boxplot
Lines

Lines

Lines
Parallel coordinates

Parallel coordinates

Parallel coordinates
Radar chart

Radar chart

Radar chart
Scatter

Scatter

Scatter
Scatter matrix

Scatter matrix

Scatter matrix
YvsX

YvsX

YvsX
ZvsXY

ZvsXY

ZvsXY