Note
Go to the end to download the full example code.
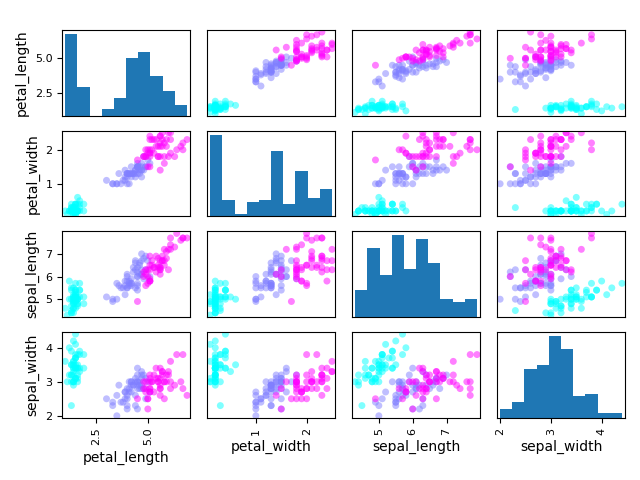
Scatter matrix#
from __future__ import annotations

from gemseo import create_benchmark_dataset
from gemseo.post.dataset.scatter_plot_matrix import ScatterMatrix
Load a dataset#
iris = create_benchmark_dataset("IrisDataset")
Plot scatter matrix#
We can use the ScatterMatrix plot where each non-diagonal block
represents the samples according to the x- and y- coordinates names
while the diagonal ones approximate the probability distributions of the
variables, using either an histogram or a kernel-density estimator.
ScatterMatrix(iris, classifier="specy").execute(save=False, show=True)
[<Figure size 640x480 with 16 Axes>]
Total running time of the script: (0 minutes 0.360 seconds)