analysis module
Abstract class for the computation and analysis of sensitivity indices.
The purpose of a sensitivity analysis is to qualify or quantify how the model’s uncertain inputs impact its outputs.
This analysis relies on SensitivityAnalysis
computed from a MDODiscipline representing the model,
a ParameterSpace describing the uncertain parameters
and options associated with a particular concrete class
inheriting from SensitivityAnalysis which is an abstract one.
- class gemseo.uncertainty.sensitivity.analysis.SensitivityAnalysis(disciplines, parameter_space, n_samples=None, output_names=None, algo=None, algo_options=None, formulation='MDF', **formulation_options)[source]
Bases:
objectSensitivity analysis.
The
SensitivityAnalysisclass provides both the values ofSensitivityAnalysis.indicesand their graphical representations, from either theSensitivityAnalysis.plot()method, theSensitivityAnalysis.plot_radar()method or theSensitivityAnalysis.plot_bar()method.It is also possible to use
SensitivityAnalysis.sort_parameters()to get the parameters sorted according toSensitivityAnalysis.main_method. TheSensitivityAnalysis.main_indicesare indices computed with the latter.Lastly, the
SensitivityAnalysis.plot_comparison()method allows to compare the currentSensitivityAnalysiswith another one.- Parameters:
disciplines (Collection[MDODiscipline]) – The discipline or disciplines to use for the analysis.
parameter_space (ParameterSpace) – A parameter space.
n_samples (int | None) – A number of samples. If
None, the number of samples is computed by the algorithm.output_names (Iterable[str] | None) – The disciplines’ outputs to be considered for the analysis. If
None, use all the outputs.algo (str | None) – The name of the DOE algorithm. If
None, use theSensitivityAnalysis.DEFAULT_DRIVER.algo_options (Mapping[str, DOELibraryOptionType] | None) – The options of the DOE algorithm.
formulation (str) –
The name of the
MDOFormulationto sample the disciplines.By default it is set to “MDF”.
**formulation_options (Any) – The options of the
MDOFormulation.
- compute_indices(outputs=None)[source]
Compute the sensitivity indices.
- Parameters:
outputs (Sequence[str] | None) – The outputs for which to display sensitivity indices. If None, use the default outputs, that are all the discipline outputs.
- Returns:
The sensitivity indices.
With the following structure:
{
    "method_name": {
        "output_name": [
            {
                "input_name": data_array,
            }
        ]
    }
}
- Return type:
- export_to_dataset()[source]
Convert
SensitivityAnalysis.indicesinto aDataset.- Returns:
The sensitivity indices.
- Return type:
- static load(file_path)[source]
Load a sensitivity analysis from the disk.
- Parameters:
file_path (str | Path) – The path to the file.
- Returns:
The sensitivity analysis.
- Return type:
- plot(output, inputs=None, title=None, save=True, show=False, file_path=None, file_format=None)[source]
Plot the sensitivity indices.
- Parameters:
output (str | tuple[str, int]) – The output for which to display sensitivity indices, either a name or a tuple of the form (name, component). If name, its first component is considered.
inputs (Iterable[str] | None) – The inputs to display. If None, display all.
title (str | None) – The title of the plot. If None, no title.
save (bool) –
If True, save the figure.
By default it is set to True.
show (bool) –
If True, show the figure.
By default it is set to False.
file_path (str | Path | None) – A file path. Either a complete file path, a directory name or a file name. If None, use a default file name and a default directory. The file extension is inferred from filepath extension, if any.
file_format (str | None) – A file format, e.g. ‘png’, ‘pdf’, ‘svg’, … Used when
file_pathdoes not have any extension. If None, use a default file extension.
- Return type:
None
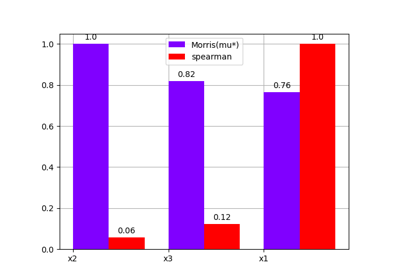
- plot_bar(outputs, inputs=None, standardize=False, title=None, save=True, show=False, file_path=None, directory_path=None, file_name=None, file_format=None, **options)[source]
Plot the sensitivity indices on a bar chart.
This method may consider one or more outputs, as well as all inputs (default behavior) or a subset.
- Parameters:
outputs (OutputsType) – The outputs for which to display sensitivity indices, either a name, a list of names, a (name, component) tuple, a list of such tuples or a list mixing such tuples and names. When a name is specified, all its components are considered. If None, use the default outputs.
inputs (Iterable[str] | None) – The inputs to display. If None, display all.
standardize (bool) –
If True, standardize the indices between 0 and 1 for each output.
By default it is set to False.
title (str | None) – The title of the plot. If None, no title.
save (bool) –
If True, save the figure.
By default it is set to True.
show (bool) –
If True, show the figure.
By default it is set to False.
file_path (str | Path | None) – The path of the file to save the figures. If the extension is missing, use
file_extension. If None, create a file path fromdirectory_path,file_nameandfile_extension.directory_path (str | Path | None) – The path of the directory to save the figures. If None, use the current working directory.
file_name (str | None) – The name of the file to save the figures. If None, use a default one generated by the post-processing.
file_format (str | None) – A file extension, e.g. ‘png’, ‘pdf’, ‘svg’, … If None, use a default file extension.
options (int) –
- Returns:
A bar chart representing the sensitivity indices.
- Return type:
- plot_comparison(indices, output, inputs=None, title=None, use_bar_plot=True, save=True, show=False, file_path=None, directory_path=None, file_name=None, file_format=None, **options)[source]
Plot a comparison between the current sensitivity indices and other ones.
This method allows to use either a bar chart (default option) or a radar one.
- Parameters:
indices (list[SensitivityAnalysis]) – The sensitivity indices.
output (str | tuple[str, int]) – The output for which to display sensitivity indices, either a name or a tuple of the form (name, component). If name, its first component is considered.
inputs (Iterable[str] | None) – The inputs to display. If None, display all.
title (str | None) – The title of the plot. If None, no title.
use_bar_plot (bool) –
The type of graph. If True, use a bar plot. Otherwise, use a radar chart.
By default it is set to True.
save (bool) –
If True, save the figure.
By default it is set to True.
show (bool) –
If True, show the figure.
By default it is set to False.
file_path (str | Path | None) – The path of the file to save the figures. If None, create a file path from
directory_path,file_nameandfile_format.directory_path (str | Path | None) – The path of the directory to save the figures. If None, use the current working directory.
file_name (str | None) – The name of the file to save the figures. If None, use a default one generated by the post-processing.
file_format (str | None) – A file format, e.g. ‘png’, ‘pdf’, ‘svg’, … If None, use a default file extension.
**options (bool) – The options passed to the underlying
DatasetPlot.
- Returns:
A graph comparing sensitivity indices.
- Return type:
- plot_field(output, mesh=None, inputs=None, standardize=False, title=None, save=True, show=False, file_path=None, directory_path=None, file_name=None, file_format=None, properties=None)[source]
Plot the sensitivity indices related to a 1D or 2D functional output.
The output is considered as a 1D or 2D functional variable, according to the shape of the mesh on which it is represented.
- Parameters:
output (str | tuple[str, int]) – The output for which to display sensitivity indices, either a name or a tuple of the form (name, component) where (name, component) is used to sort the inputs. If it is a name, its first component is considered.
mesh (ndarray | None) – The mesh on which the p-length output is represented. Either a p-length array for a 1D functional output or a (p, 2) array for a 2D one. If None, assume a 1D functional output.
inputs (Iterable[str] | None) – The inputs to display. If None, display all inputs.
standardize (bool) –
If True, standardize the indices between 0 and 1 for each output.
By default it is set to False.
title (str | None) – The title of the plot. If None, no title is displayed.
save (bool) –
If True, save the figure.
By default it is set to True.
show (bool) –
If True, show the figure.
By default it is set to False.
file_path (str | Path | None) – The path of the file to save the figures. If None, create a file path from
directory_path,file_nameandfile_extension.directory_path (str | Path | None) – The path of the directory to save the figures. If None, use the current working directory.
file_name (str | None) – The name of the file to save the figures. If None, use a default one generated by the post-processing.
file_format (str | None) – A file extension, e.g. ‘png’, ‘pdf’, ‘svg’, … If None, use a default file extension.
properties (Mapping[str, DatasetPlotPropertyType]) – The general properties of a
DatasetPlot.
- Returns:
A bar plot representing the sensitivity indices.
- Raises:
NotImplementedError – If the dimension of the mesh is greater than 2.
- Return type:
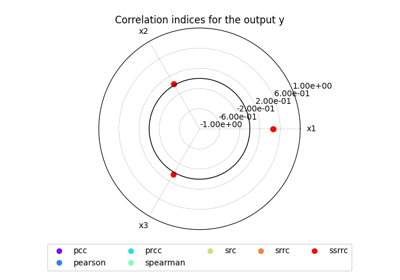
- plot_radar(outputs, inputs=None, standardize=False, title=None, save=True, show=False, file_path=None, directory_path=None, file_name=None, file_format=None, min_radius=None, max_radius=None, **options)[source]
Plot the sensitivity indices on a radar chart.
This method may consider one or more outputs, as well as all inputs (default behavior) or a subset.
For visualization purposes, it is also possible to change the minimum and maximum radius values.
- Parameters:
outputs (OutputsType) – The outputs for which to display sensitivity indices, either a name, a list of names, a (name, component) tuple, a list of such tuples or a list mixing such tuples and names. When a name is specified, all its components are considered. If None, use the default outputs.
inputs (Iterable[str] | None) – The inputs to display. If None, display all.
standardize (bool) –
If True, standardize the indices between 0 and 1 for each output.
By default it is set to False.
title (str | None) – The title of the plot. If None, no title.
save (bool) –
If True, save the figure.
By default it is set to True.
show (bool) –
If True, show the figure.
By default it is set to False.
file_path (str | Path | None) – The path of the file to save the figures. If the extension is missing, use
file_extension. If None, create a file path fromdirectory_path,file_nameandfile_extension.directory_path (str | Path | None) – The path of the directory to save the figures. If None, use the current working directory.
file_name (str | None) – The name of the file to save the figures. If None, use a default one generated by the post-processing.
file_format (str | None) – A file extension, e.g. ‘png’, ‘pdf’, ‘svg’, … If None, use a default file extension.
min_radius (float | None) – The minimal radial value. If None, from data.
max_radius (float | None) – The maximal radial value. If None, from data.
options (bool) –
- Returns:
A radar chart representing the sensitivity indices.
- Return type:
- save(file_path)[source]
Save the current sensitivity analysis on the disk.
- Parameters:
file_path (str | Path) – The path to the file.
- Return type:
None
- sort_parameters(output)[source]
Return the parameters sorted in descending order.
- Parameters:
output (str | tuple[str, int]) – Either a tuple as
(output_name, output_component)or an output name; in the second case, use the first output component.- Returns:
The input parameters sorted by decreasing order of sensitivity; in case of a multivariate input, aggregate the sensitivity indices associated to the different input components by adding them up typically.
- Return type:
- static standardize_indices(indices)[source]
Standardize the sensitivity indices for each output component.
Each index is replaced by its absolute value divided by the largest index. Thus, the standardized indices belong to the interval \([0,1]\).
- DEFAULT_DRIVER = None
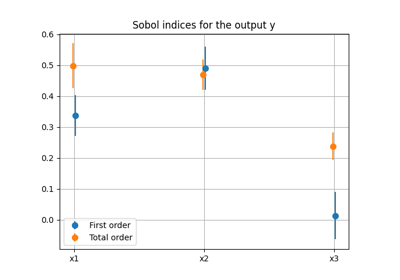
- property indices: dict[str, Dict[str, List[Dict[str, numpy.ndarray]]]]
The sensitivity indices.
With the following structure:
{
    "method_name": {
        "output_name": [
            {
                "input_name": data_array,
            }
        ]
    }
}