Study analyses
The CouplingStudyAnalysis and MDOStudyAnalysis are tools based on an Excel file
to specify and analyze a study, even before wrapping any software.
No executable code is produced, the idea is to assist the discussions with design and field experts, customers, to define the MDO problem, from the white sheet. This way, the study may be visualized before any process or tool being actually ready.
There is no need to write any line of code to use this tool. A command line executable is available.
Coupling study analysis
The CouplingStudyAnalysis helps the user to check the couplings between various disciplines.
The user only has to fill an Excel file with one worksheet per discipline defining the input and output names.
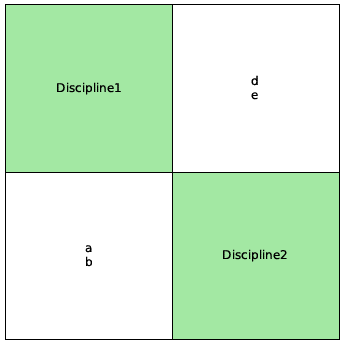
The result of the analysis is a N2 (or DSM) diagram
MDO study analysis
The MDOStudyAnalysis helps the user to define the right MDO problem to be solved.
The user only has to fill an Excel file with one worksheet per discipline defining the input and output names and one worksheet per scenario (at least the main scenario, and multiple scenarios for distributive formulations) defining the names of the objectives, constraints, design variables, disciplines, formulation and options.
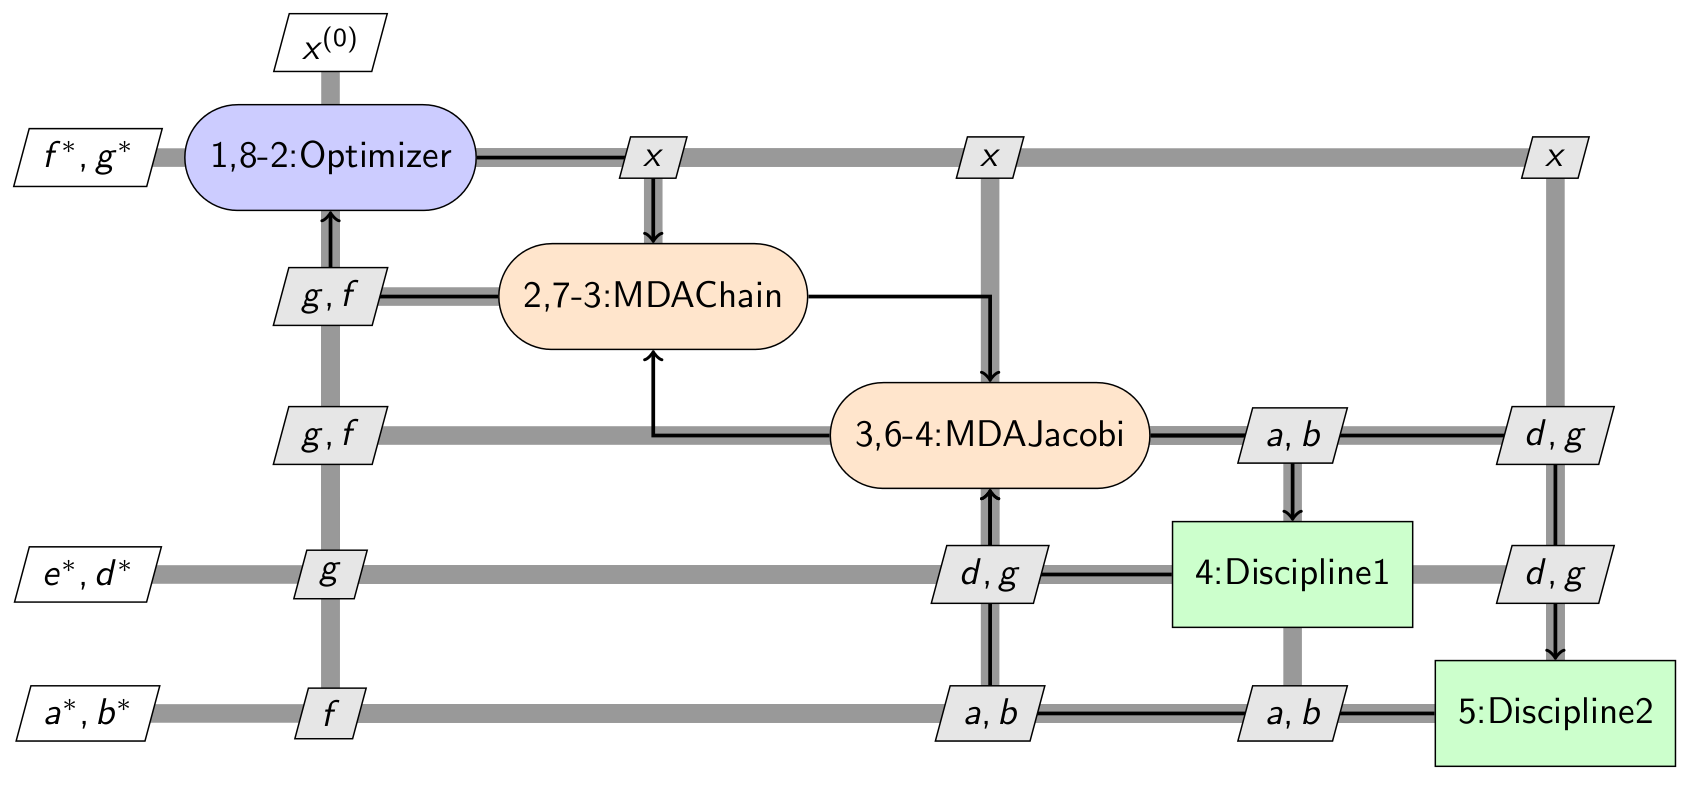
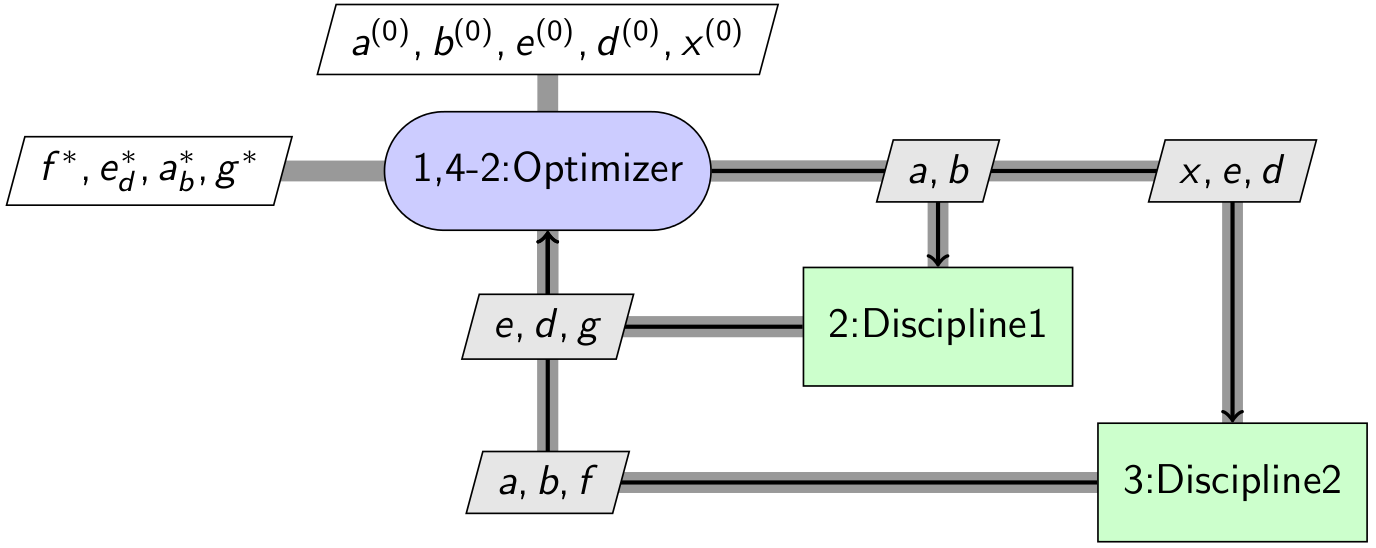
The result of the analysis are a N2 (or DSM) and XDSM diagrams (see more explanations here XDSM).
Examples
The next figure illustrates how this tool can be used to create an MDOStudyAnalysis.
This requires the creation of an Excel workbook with one sheet per discipline.
The name of the discipline is given by the name of the sheet.
On each of these sheets, the inputs and outputs of the discipline must be given.

Disciplines definition
Scenarios are defined by sheet names starting with “Scenario”.

Scenario definition
The N2 and XDSM diagrams can be generated from such as study file. The N2 diagrams are generated as pdf files. The XDSM diagrams are generated as standalone HTML files, by default, or as LaTex and PDF files as an option (-l).

N2 of the study

MDF XDSM diagram of the study

IDF XDSM diagram of the study
For more complex use cases, multi-level formulations can also be used.
You first need to define the sub-scenarios in dedicated sheets,
and then add the names of these sheets in the cell block Disciplines of the sheet defining the main scenario.
Finally, a multilevel MDO formulation has to be chosen, e.g. "BiLevel".

Definition of a scenario based on a bi-level formulation
Class documentation
- class gemseo.utils.study_analyses.mdo_study_analysis.MDOStudyAnalysis(xls_study_path)[source]
An MDO study analysis from an Excel specification.
Based on an Excel file defining disciplines in terms of input and output names and an MDO problem in terms of names of design variables, objectives, constraints and formulation, this analysis generates an N2 (equivalent to the Design Structure Matrix) diagram, showing the couplings between the disciplines, and an XDSM (Extended Design Structure Matrix), showing the MDO process.
The Excel file shall contain one sheet per discipline:
the name of the sheet shall have the discipline name,
the sheet shall define the input names of the discipline as a vertical succession of cells starting with
"Inputs":Inputs¶ Inputs
input_name_1
…
input_name_N
the sheet shall define the output names of the discipline as a vertical succession of cells starting with
"Outputs":
Outputs¶ Outputs
output_name_1
…
output_name_N
the empty lines of the series
InputsandOutputsare ignored,the sheet may contain other data, but these will not be taken into account.
The scenarios (at least one, or multiple for distributed formulations) must appear in a Excel sheet with a name starting by
Scenario.The sheet shall have the following columns:
Scenario1¶ Design variables
Objective function
Constraints
Disciplines
Formulation
Options
Options values
in1
out1
out2
Disc1
MDF
tolerance
0.1
Disc2
main_mda_name
MDAJacobi
These columns must satisfy some constraints:
all of them are mandatory, even if empty for the constraints,
their order does not matter,
one and only one formulation must be declared,
at least one objective must be provided,
at least one design variable must be provided,
all the objective functions and constraints must be outputs of a discipline, not necessarily the one of the current sheet,
all the design variables must be inputs of a discipline, not necessarily the one of the current sheet.
The columns
OptionsandOptions valuesare used to pass the formulation options. Note that for string typeOption values, the value can be written with or without the""characters.To use multi-level MDO formulations, create multiple scenarios, and add the name of the sub-scenarios in the list of disciplines of the main (system) scenario.
An arbitrary number of levels can be generated this way (three, four, …, n, level formulations).
- Parameters:
xls_study_path (str | Path) – The path to the Excel file describing the study.
- generate_coupling_graph(file_path='coupling_graph.pdf', full=True)
Generate the coupling graph based on the disciplines.
- generate_n2(file_path='n2.pdf', show_data_names=True, save=True, show=False, fig_size=(15, 10), show_html=False)
Generate the N2 based on the disciplines.
- Parameters:
file_path (str | Path) –
The file path to save the static N2 chart.
By default it is set to “n2.pdf”.
show_data_names (bool) –
Whether to show the names of the coupling variables between two disciplines; otherwise, circles are drawn, whose size depends on the number of coupling names.
By default it is set to True.
save (bool) –
Whether to save the static N2 chart.
By default it is set to True.
show (bool) –
Whether to show the static N2 chart.
By default it is set to False.
fig_size (FigSizeType) –
The width and height of the static N2 chart.
By default it is set to (15, 10).
show_html (bool) –
Whether to display the interactive N2 chart in a web browser.
By default it is set to False.
- Return type:
None
- generate_xdsm(directory_path='.', save_pdf=False, show_html=False)[source]
Create an XDSM diagram of the
main_scenario.- Parameters:
- Returns:
The XDSM diagram of the
main_scenario.- Return type:
- disciplines: dict[str, MDODiscipline]
The disciplines.
- main_scenario: MDOScenario
The main scenario.
- scenarios: dict[str, MDOScenario]
The sub-scenarios and the main scenario in the last position.
- study: XLSStudyParser
The XLSStudyParser instance built from the Excel file.
Usage of the command line executable
GEMSEO installation provides the gemseo-study command line executable. This tool allows the generation of an N2 chart and an XDSM diagram from an Excel description file.
Its usage is:
gemseo-study [-h] [-o OUT_DIR] [-x] [-p] [--height HEIGHT] [--width WIDTH] [-t STUDY_TYPE] study_file
with
- positional arguments:
study_file The path of the XLS file that describes the study.
- optional arguments:
- -h, --help
show this help message and exit
- -t, --study-type
The type of the study (either coupling or mdo).
- -o OUT_DIR, --out_dir OUT_DIR
The path of the directory to save the files.
- -x, --xdsm
Whether to generate an XDSM; compatible only with the study type ‘mdo’.
- -p, --save-pdf
Whether to save the XDSM as a PDF file.
- --height HEIGHT
The height of the N2 figure in inches.
- --width WIDTH
The width of the N2 figure in inches.
